
A convolution-based neural network for the task of object detection.
Benchmarking
Benchmarking can be performed for both training and inference. Both the scripts run the EfficientDet model. You can specify whether benchmarking is performed in AMP, TF32, or FP32 by specifying it as an argument to the benchmarking scripts.
Training performance benchmark
Training benchmarking can be performed by running the script:
NGPU=<number of GPUs> bash scripts/D0/training-benchmark-{AMP, TF32, FP32}-{V100-32G, A100-80G}.sh
To train on 1 DGXA100-80G run script:
bash scripts/D0/training-benchmark-{AMP, TF32}-1xA100-80G.sh
Inference performance benchmark
Inference benchmarking can be performed by running the script:
AMP=<enable mixed precision training? TRUE/FALSE> BS=<inference batchsize> bash scripts/D0/inference-benchmark.sh
Results
The following sections provide details on how we achieved our performance and accuracy in training and inference.
Training Accuracy Results
Training accuracy: NVIDIA DGX A100 (8x A100 80GB)
Our results were obtained by running the scripts/D0/convergence-{AMP, TF32}-8xA100-80G.sh training script in the 22.03-tf2 NGC container on NVIDIA DGX A100 (8x A100 80GB) GPUs while evaluating every 10 epochs after 200 epochs of training until the 300th epoch is completed.
| GPUs | Image size | Precision | Local Batch size | BBOX mAP | Time to train | Time to train - speedup (TF32 to mixed precision) |
|---|---|---|---|---|---|---|
| 8 | 512 x 512 | TF32 | 104 | 34.53 | 8.5 hrs | - |
| 8 | 512 x 512 | FP16 | 200 | 34.27 | 4.6 hrs | 1.84x |
Training accuracy: NVIDIA DGX-1 (8x V100 32GB)
Our results were obtained by running the scripts/D0/convergence-{AMP, FP32}-8xV100-32G.sh training script in the 22.03-tf2 NGC container on NVIDIA DGX-1 with 8x V100 32GB GPUs with no intermediate evaluation.
| GPUs | Image size | Precision | Local Batch size | BBOX mAP | Time to train | Time to train - speedup (FP32 to mixed precision) |
|---|---|---|---|---|---|---|
| 8 | 512 x 512 | FP32 | 40 | 34.42 | 16.9 hrs | - |
| 8 | 512 x 512 | FP16 | 64 | 34.45 | 14.3 hrs | 1.18x |
Training accuracy: NVIDIA DGX-1 (32x V100 32GB)
Our results were obtained by running the scripts/D0/convergence-{AMP, FP32}-32xV100-32G.sub training script in the 22.03-tf2 NGC container on NVIDIA DGX-1 with 32x V100 32GB GPUs with no intermediate evaluation.
| GPUs | Image size | Precision | Local Batch size | BBOX mAP | Time to train | Time to train - speedup (FP32 to mixed precision) |
|---|---|---|---|---|---|---|
| 32 | 512 x 512 | FP32 | 40 | 34.14 | 5.6 hrs | - |
| 32 | 512 x 512 | FP16 | 64 | 34.02 | 4.19 hrs | 1.33x |
Training loss curves
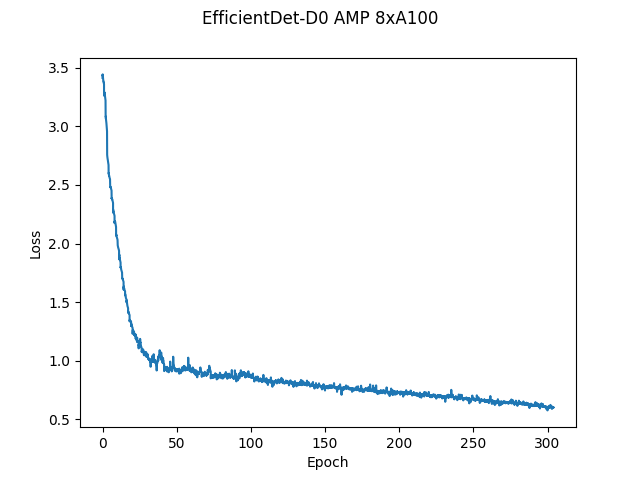
Here, the loss is simply the weighted sum of losses on the classification head and the bounding box head.
Training Stability Test
The following tables compare mAP scores across five different training runs with different seeds. The runs showcase consistent convergence on all five seeds with very little deviation.
| Config | Seed 1 | Seed 2 | Seed 3 | Seed 4 | Seed 5 | Mean | Standard Deviation |
|---|---|---|---|---|---|---|---|
| 8 GPUs, final AP BBox | 34.38 | 34.56 | 34.3 | 34.34 | 34.4 | 34.39 | 0.1 |
Training Performance Results
Training performance: NVIDIA DGX A100 (8x A100 80GB)
Our results were obtained by running the scripts/D0/training-benchmark-{AMP, TP32}-A100-80G.sh training script in the 22.03-tf2 NGC container on NVIDIA DGX A100 (8x A100 80GB) GPUs. Performance numbers in images per second were averaged over an entire training epoch. The number of GPUs used to benchmark can be set as NGPU=<4/8>. For 1-gpu benchmarking run script scripts/D0/training-benchmark-{AMP, TP32}-1xA100-80G.sh
| GPUs | Throughput - TF32 (BS=104) | Throughput - mixed precision (BS=200) | Throughput speedup (TF32 - mixed precision) | Weak scaling - TF32 | Weak scaling - mixed precision |
|---|---|---|---|---|---|
| 1 | 162 | 397 | 2.45 | 1 | 1 |
| 8 | 1266 | 2711 | 2.14 | 7.81 | 6.82 |
Training performance: NVIDIA DGX-1 (8x V100 32GB)
Our results were obtained by running the scripts/D0/training-benchmark-{AMP, FP32}-V100-32G.sh training script in the 22.03-tf2 NGC container on NVIDIA DGX-1 with (8x V100 32GB) GPUs. Performance numbers in images per second were averaged over an entire training epoch. The number of GPUs used to benchmark can be set as NGPU=<1/4/8>.
| GPUs | Throughput - FP32 (BS=40) | Throughput - mixed precision (BS=64) | Throughput speedup (FP32 - mixed precision) | Weak scaling - FP32 | Weak scaling - mixed precision |
|---|---|---|---|---|---|
| 1 | 113 | 232 | 2.05 | 1 | 1 |
| 8 | 645 | 777 | 1.2 | 5.7 | 3.34 |
To achieve similar results, follow the steps in the Quick Start Guide. Note: The dataloader is a performance bottleneck for this model. So the training throughputs could be higher if the bottleneck is optimized further.
Inference performance results
Inference performance: NVIDIA DGX A100 (1x A100 80GB)
Our results were obtained by running the scripts/inference-benchmark.sh training script in the 22.03-tf2 NGC container on NVIDIA DGX A100 (1x A100 80GB) GPU. The image resolution is 512 x 512.
FP16 Inference Latency
| Batch size | Throughput Avg | Latency Avg (ms) | Latency 90% (ms) | Latency 95% (ms) | Latency 99% (ms) |
|---|---|---|---|---|---|
| 1 | 38 | 26.31 | 26.27 | 26.29 | 26.31 |
| 2 | 40 | 49.75 | 49.68 | 49.71 | 49.74 |
| 4 | 80 | 50.12 | 50.06 | 50.08 | 50.11 |
| 8 | 153 | 52.16 | 52.09 | 52.12 | 52.15 |
| 16 | 276 | 57.83 | 57.77 | 57.79 | 57.81 |
| 32 | 465 | 68.75 | 68.69 | 68.72 | 68.74 |
| 64 | 706 | 90.63 | 90.56 | 90.59 | 90.62 |
| 128 | 791 | 161.65 | 160.94 | 161.08 | 161.14 |
| 256 | 858 | 298.33 | 296.1 | 296.62 | 297.76 |
TF32 Inference Latency
| Batch size | Throughput Avg | Latency Avg (ms) | Latency 90% (ms) | Latency 95% (ms) | Latency 99% (ms) |
|---|---|---|---|---|---|
| 1 | 38 | 26.09 | 26 | 26.03 | 26.07 |
| 2 | 40 | 49.94 | 49.84 | 49.88 | 49.91 |
| 4 | 78 | 50.98 | 50.91 | 50.94 | 50.96 |
| 8 | 144 | 55.21 | 55.16 | 55.19 | 55.21 |
| 16 | 250 | 63.76 | 63.69 | 63.72 | 63.75 |
| 32 | 394 | 81.06 | 80.97 | 81 | 81.04 |
| 64 | 563 | 113.54 | 113.44 | 113.47 | 113.51 |
| 128 | 623 | 205.33 | 205.06 | 205.16 | 205.28 |
To achieve similar results, follow the steps in the Quick Start Guide.
Inference performance: NVIDIA DGX-1 (1x V100 32GB)
Our results were obtained by running the scripts/inference-benchmark.sh training script in the 22.03-tf2 NGC container on NVIDIA DGX-1 with 1x V100 32GB GPUs. The image resolution is 512 x 512.
FP16 Inference Latency
| Batch size | Throughput Avg | Latency Avg (ms) | Latency 90% (ms) | Latency 95% (ms) | Latency 99% (ms) |
|---|---|---|---|---|---|
| 1 | 35 | 27.84 | 27.67 | 27.74 | 27.82 |
| 2 | 40 | 49.81 | 49.42 | 49.62 | 49.77 |
| 4 | 81 | 49.35 | 49.3 | 49.32 | 49.34 |
| 8 | 146 | 54.51 | 54.44 | 54.47 | 54.5 |
| 16 | 245 | 65.07 | 65.01 | 65.04 | 65.06 |
| 32 | 366 | 87.24 | 87.1 | 87.16 | 87.22 |
| 64 | 477 | 134.09 | 133.98 | 134.02 | 134.07 |
| 128 | 497 | 257.39 | 257.09 | 257.19 | 257.34 |
FP32 Inference Latency
| Batch size | Throughput Avg | Latency Avg (ms) | Latency 90% (ms) | Latency 95% (ms) | Latency 99% (ms) |
|---|---|---|---|---|---|
| 1 | 36 | 27.21 | 27.02 | 27.11 | 27.19 |
| 2 | 39 | 51.04 | 50.81 | 50.91 | 51.01 |
| 4 | 78 | 51.23 | 51.19 | 51.21 | 51.22 |
| 8 | 135 | 59.06 | 58.98 | 59.02 | 59.06 |
| 16 | 214 | 74.73 | 74.64 | 74.68 | 74.71 |
| 32 | 305 | 104.76 | 104.67 | 104.72 | 104.76 |
| 64 | 374 | 171.08 | 170.92 | 170.98 | 171.05 |
| 128 | 385 | 332.11 | 331.81 | 331.92 | 332.06 |
To achieve these same results, follow the steps in the Quick Start Guide.