
Wide & Deep Recommender model.
Benchmarking
The following section shows how to run benchmarks measuring the model performance in training mode.
Training and evaluation performance benchmark
A benchmark script is prepared to measure the performance of the model during training (default configuration) and evaluation (--evaluation). Benchmark runs training or evaluation for --benchmark_steps batches; however measurement of performance starts after --benchmark_warmup_steps. A benchmark can be run for single and 8 GPUs and with a combination of XLA (--xla), AMP (--amp), batch sizes (--global_batch_size , --eval_batch_size), and affinity (--affinity).
To run a benchmark, follow these steps:
Run Wide & Deep Container (${HOST_OUTBRAIN_PATH} is the path with Outbrain dataset):
docker run --runtime=nvidia --gpus=all --rm -it --ipc=host -v ${HOST_OUTBRAIN_PATH}:/outbrain wd2 bash
Run the benchmark script:
horovodrun -np ${GPU} sh hvd_wrapper.sh python main.py --benchmark
Results
The following sections provide details on how we achieved our performance and accuracy in training.
Training accuracy results
Training accuracy: NVIDIA DGX A100 (8x A100 80GB)
Our results were obtained by running the main.py training script in the TensorFlow2 NGC container on NVIDIA DGX A100 with (8x A100 80GB) GPUs.
| GPUs | Batch size / GPU | XLA | Accuracy - TF32 (MAP@12) | Accuracy - mixed precision (MAP@12) | Time to train - TF32 (minutes) | Time to train - mixed precision (minutes) | Time to train speedup (TF32 to mixed precision) |
|---|---|---|---|---|---|---|---|
| 1 | 131072 | Yes | 0.65729 | 0.65732 | 17.33 | 13.37 | 1.30 |
| 1 | 131072 | No | 0.65732 | 0.65730 | 21.90 | 17.55 | 1.25 |
| 8 | 16384 | Yes | 0.65748 | 0.65754 | 6.78 | 6.53 | 1.04 |
| 8 | 16384 | No | 0.65748 | 0.65750 | 8.38 | 8.28 | 1.01 |
To achieve the same results, follow the steps in the Quick Start Guide.
Training accuracy: NVIDIA DGX-1 (8x V100 32GB)
Our results were obtained by running the main.py training script in the TensorFlow2 NGC container on NVIDIA DGX-1 with (8x V100 32GB) GPUs.
| GPUs | Batch size / GPU | XLA | Accuracy - FP32 (MAP@12) | Accuracy - mixed precision (MAP@12) | Time to train - FP32 (minutes) | Time to train - mixed precision (minutes) | Time to train speedup (FP32 to mixed precision) |
|---|---|---|---|---|---|---|---|
| 1 | 131072 | Yes | 0.65726 | 0.65732 | 72.02 | 24.80 | 2.90 |
| 1 | 131072 | No | 0.65732 | 0.65733 | 79.47 | 31.50 | 2.52 |
| 8 | 16384 | Yes | 0.65744 | 0.65752 | 15.95 | 10.32 | 1.55 |
| 8 | 16384 | No | 0.65746 | 0.65756 | 18.52 | 12.87 | 1.44 |
To achieve the same results, follow the steps in the Quick Start Guide.
Training accuracy plots
Models trained with FP32, TF32, and Automatic Mixed Precision (AMP), with and without XLA enabled achieve similar accuracy.
The plot represents MAP@12 in a function of steps (step is single batch) during training for default precision (FP32 for Volta architecture (DGX-1) and TF32 for Ampere GPU architecture (DGX-A100)) and AMP for XLA and without it for NVTabular dataset. All other parameters of training are default.
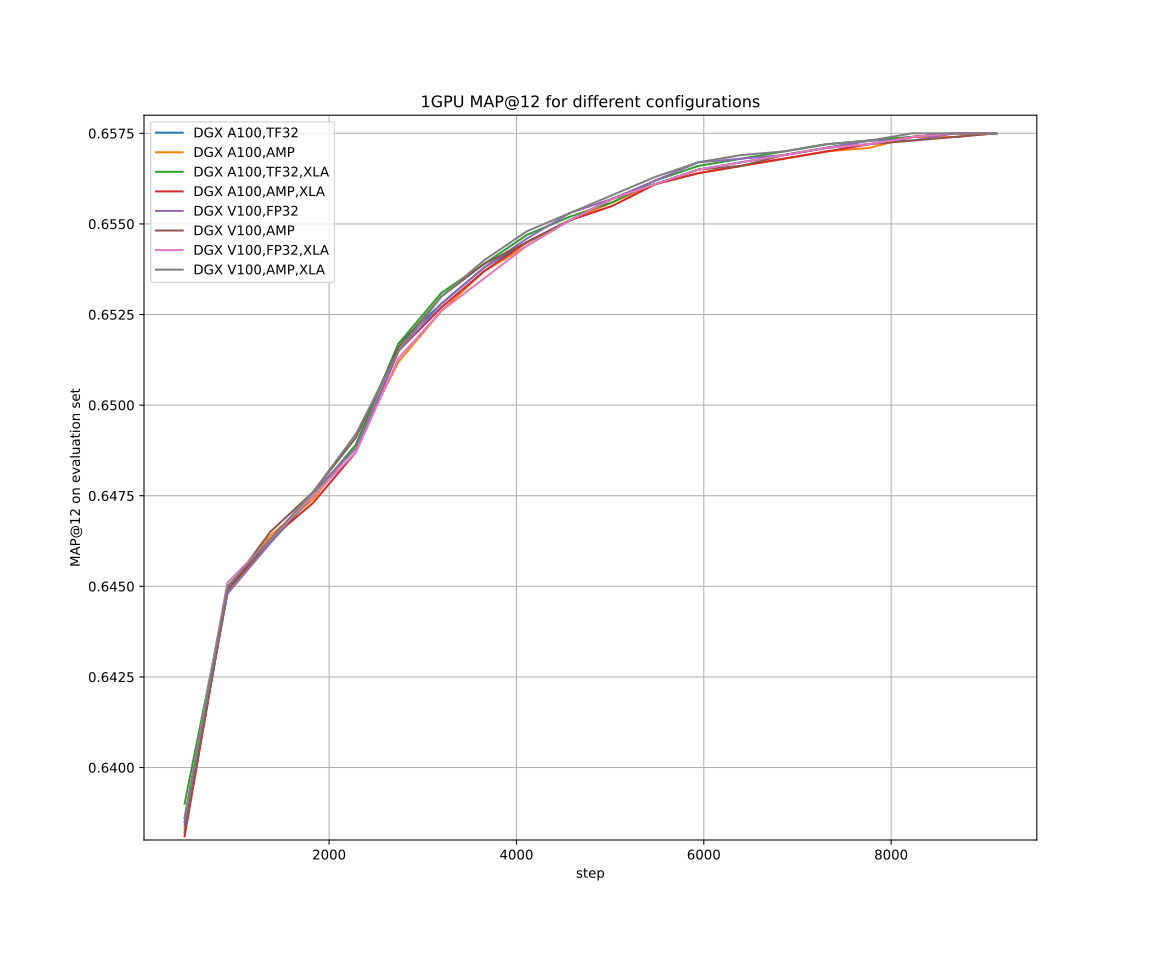
Figure 2. Learning curves for different configurations on single gpu.
Training stability test
Training of the model is stable for multiple configurations achieving the standard deviation of 10e-4. The model achieves similar MAP@12 scores for A100 and V100, training precisions, XLA usage, and single/multi GPU. The Wide & Deep model was trained for 9140 training steps (20 epochs, 457 batches in each epoch, every batch containing 131072), starting from 20 different initial random seeds for each setup. The training was performed in the 22.03 Merlin Tensorflow Training NGC container on NVIDIA DGX A100 80GB, and DGX-1 32GB machines with and without mixed precision enabled, with and without XLA enabled for NVTabular generated dataset. The provided charts and numbers consider single and eight GPU training. After training, the models were evaluated on the validation set. The following plots compare distributions of MAP@12 on the evaluation set. In columns, there is single vs. eight GPU training in rows DGX A100 and DGX-1 V100.
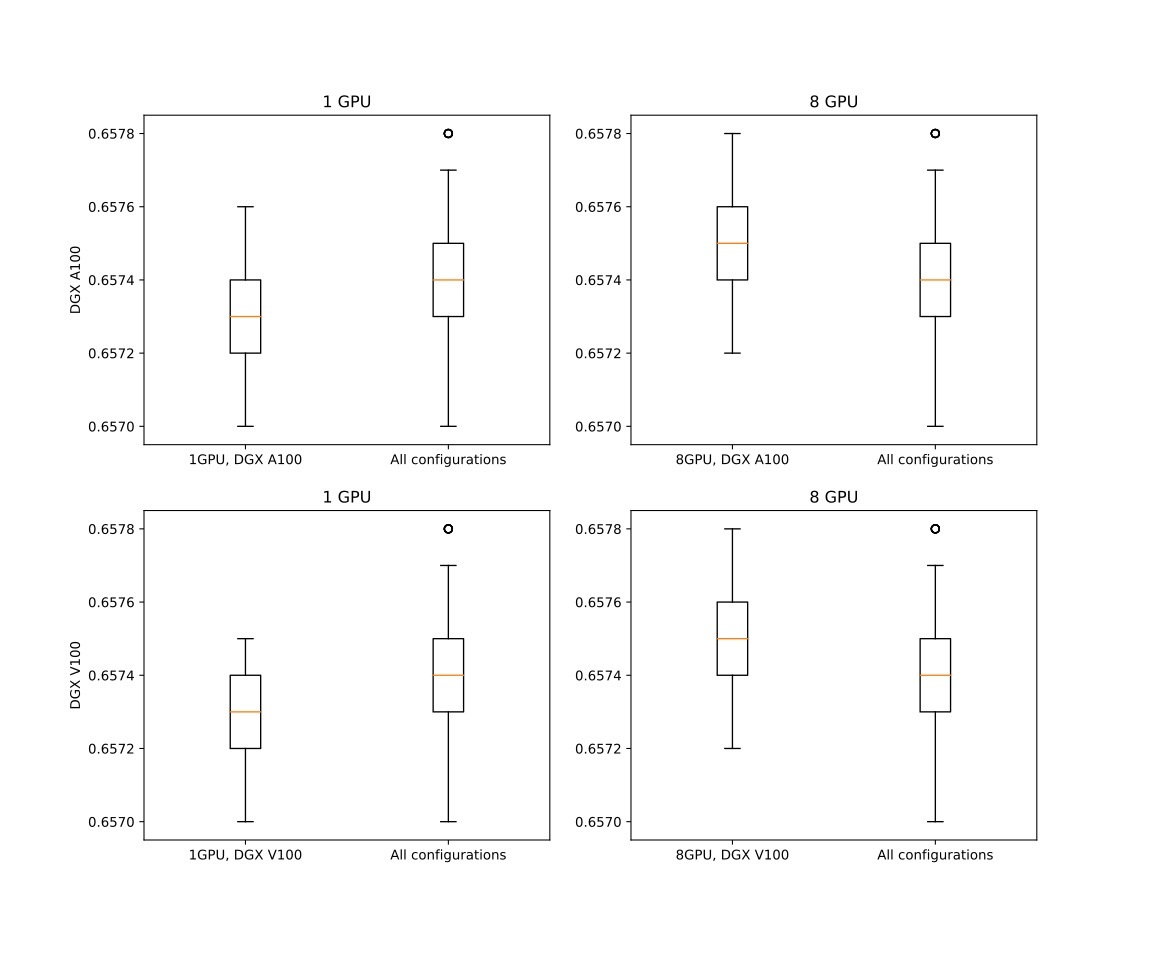
Figure 3. Training stability plot, distribution of MAP@12 across different configurations. 'All configurations' refer to the distribution of MAP@12 for cartesian product of architecture, training precision, XLA usage, single/multi GPU.
Training stability was also compared in terms of point statistics for MAP@12 distribution for multiple configurations. Refer to the expandable table below.
Full tabular data for training stability tests
| GPUs | Precision | XLA | Mean | Std | Min | Max | |
|---|---|---|---|---|---|---|---|
| DGX A100 | 1 | TF32 | Yes | 0.65729 | 0.00013 | 0.6571 | 0.6576 |
| DGX A100 | 1 | TF32 | No | 0.65732 | 0.00011 | 0.6571 | 0.6575 |
| DGX A100 | 1 | AMP | Yes | 0.65732 | 0.00010 | 0.6572 | 0.6575 |
| DGX A100 | 1 | AMP | No | 0.65730 | 0.00014 | 0.6570 | 0.6576 |
| DGX A100 | 8 | TF32 | Yes | 0.65748 | 0.00014 | 0.6573 | 0.6577 |
| DGX A100 | 8 | TF32 | No | 0.65748 | 0.00012 | 0.6572 | 0.6576 |
| DGX A100 | 8 | AMP | Yes | 0.65754 | 0.00012 | 0.6573 | 0.6578 |
| DGX A100 | 8 | AMP | No | 0.65750 | 0.00015 | 0.6572 | 0.6578 |
| DGX-1 V100 | 1 | FP32 | Yes | 0.65726 | 0.00011 | 0.6570 | 0.6574 |
| DGX-1 V100 | 1 | FP32 | No | 0.65732 | 0.00013 | 0.6571 | 0.6575 |
| DGX-1 V100 | 1 | AMP | Yes | 0.65732 | 0.00006 | 0.6572 | 0.6574 |
| DGX-1 V100 | 1 | AMP | No | 0.65733 | 0.00010 | 0.6572 | 0.6575 |
| DGX-1 V100 | 8 | FP32 | Yes | 0.65744 | 0.00014 | 0.6573 | 0.6578 |
| DGX-1 V100 | 8 | FP32 | No | 0.65746 | 0.00011 | 0.6572 | 0.6576 |
| DGX-1 V100 | 8 | AMP | Yes | 0.65752 | 0.00016 | 0.6573 | 0.6578 |
| DGX-1 V100 | 8 | AMP | No | 0.65756 | 0.00013 | 0.6573 | 0.6578 |
Impact of mixed precision on training accuracy
The accuracy of training, measured with MAP@12 on the evaluation set after the final epoch metric was not impacted by enabling mixed precision. The obtained results were statistically similar. The similarity was measured according to the following procedure:
The model was trained 20 times for default settings (FP32 or TF32 for NVIDIA Volta and NVIDIA Ampere architecture, respectively) and 20 times for AMP. After the last epoch, the accuracy score MAP@12 was calculated on the evaluation set.
Distributions for four configurations: architecture (A100, V100) and single/multi GPU for the NVTabular dataset are presented below.
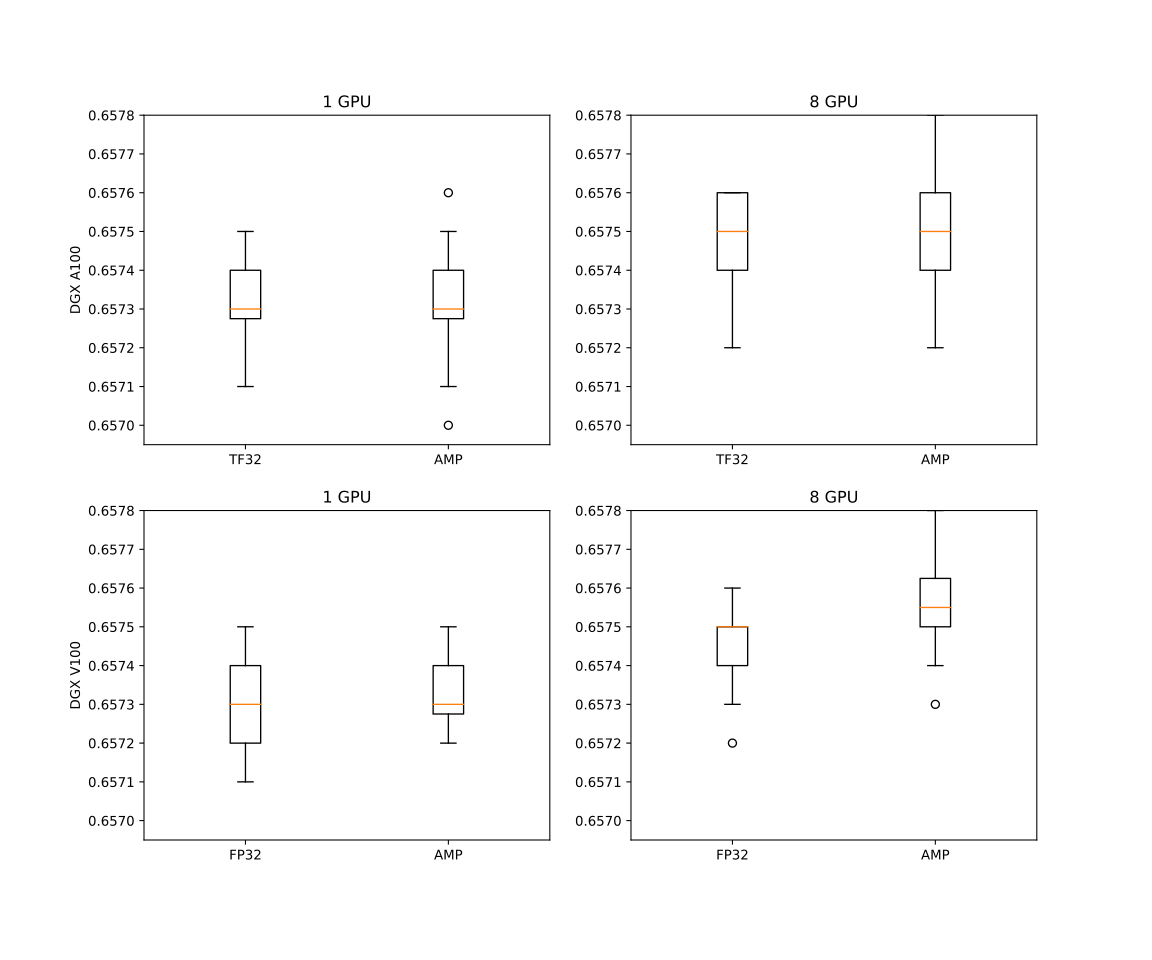
Figure 4. Influence of AMP on MAP@12 distribution for DGX A100 and DGX-1 V100 for single and multi GPU training.
Distribution scores for full precision training and AMP training were compared in terms of mean, variance, and Kolmogorov–Smirnov test to state statistical difference between full precision and AMP results. Refer to the expandable table below.
Full tabular data for AMP influence on MAP@12
| GPUs | XLA | Mean MAP@12 for Full precision (TF32 for A100, FP32 for V100) | Std MAP@12 for Full precision (TF32 for A100, FP32 for V100) | Mean MAP@12 for AMP | Std MAP@12 for AMP | KS test value: statistics, p-value | |
|---|---|---|---|---|---|---|---|
| DGX A100 | 1 | Yes | 0.65729 | 0.00013 | 0.65732 | 0.00010 | 0.15000 (0.98314) |
| DGX A100 | 8 | Yes | 0.65748 | 0.00014 | 0.65754 | 0.00012 | 0.20000 (0.83197) |
| DGX A100 | 1 | No | 0.65732 | 0.00011 | 0.65730 | 0.00014 | 0.10000 (0.99999) |
| DGX A100 | 8 | No | 0.65748 | 0.00012 | 0.65750 | 0.00015 | 0.15000 (0.98314) |
| DGX-1 V100 | 1 | Yes | 0.65726 | 0.00011 | 0.65732 | 0.00006 | 0.40000 (0.08106) |
| DGX-1 V100 | 8 | Yes | 0.65744 | 0.00014 | 0.65752 | 0.00016 | 0.20000 (0.83197) |
| DGX-1 V100 | 1 | No | 0.65732 | 0.00013 | 0.65733 | 0.00010 | 0.10000 (0.99999) |
| DGX-1 V100 | 8 | No | 0.65746 | 0.00011 | 0.65756 | 0.00013 | 0.30000 (0.33559) |
Training performance results
Training performance: NVIDIA DGX A100 (8x A100 80GB)
Our results were obtained by running the benchmark script (main.py --benchmark) in the TensorFlow2 NGC container on NVIDIA DGX A100 with (8x A100 80GB) GPUs.
| GPUs | Batch size / GPU | XLA | Throughput - TF32 (samples/s) | Throughput - mixed precision (samples/s) | Throughput speedup (TF32 - mixed precision) | Strong scaling - TF32 | Strong scaling - mixed precision |
|---|---|---|---|---|---|---|---|
| 1 | 131072 | Yes | 1640579.8 | 2312149.2 | 1.41 | 1.00 | 1.00 |
| 1 | 131072 | No | 1188653.48 | 1569403.04 | 1.32 | 1.00 | 1.00 |
| 8 | 16384 | Yes | 5369859.03 | 5742941.1 | 1.07 | 3.27 | 2.48 |
| 8 | 16384 | No | 3767868.65 | 3759027.04 | 1.00 | 3.17 | 2.40 |
Training performance: NVIDIA DGX-1 (8x V100 32GB)
Our results were obtained by running the benchmark script (main.py --benchmark) in the TensorFlow2 NGC container on NVIDIA DGX-1 with (8x V100 32GB) GPUs.
| GPUs | Batch size / GPU | XLA | Throughput - FP32 (samples/s) | Throughput - mixed precision (samples/s) | Throughput speedup (FP32 - mixed precision) | Strong scaling - FP32 | Strong scaling - mixed precision |
|---|---|---|---|---|---|---|---|
| 1 | 131072 | Yes | 346096.2 | 1102253.52 | 3.18 | 1.00 | 1.00 |
| 1 | 131072 | No | 292483.81 | 822245.68 | 2.81 | 1.00 | 1.00 |
| 8 | 16384 | Yes | 1925045.33 | 3536706.63 | 1.84 | 5.56 | 3.21 |
| 8 | 16384 | No | 1512064.59 | 2434945.55 | 1.61 | 5.17 | 2.96 |
Evaluation performance results
Evaluation performance: NVIDIA DGX A100 (8x A100 80GB)
Our results were obtained by running the benchmark script (main.py --evaluate --benchmark) in the TensorFlow2 NGC container on NVIDIA DGX A100 with 8x A100 80GB GPUs.
| GPUs | Batch size / GPU | XLA | Throughput [samples/s] TF32 | Throughput [samples/s] AMP | Throughput speedup AMP to TF32 |
|---|---|---|---|---|---|
| 1 | 4096 | No | 594773 | 556904 | 0.94 |
| 1 | 8192 | No | 932078 | 919439 | 0.99 |
| 1 | 16384 | No | 1351977 | 1411866 | 1.04 |
| 1 | 32768 | No | 1790851 | 1794104 | 1.00 |
| 1 | 65536 | No | 2101918 | 2263452 | 1.08 |
| 1 | 131072 | No | 2339848 | 2593955 | 1.11 |
| 8 | 4096 | No | 4199683 | 3668578 | 0.87 |
| 8 | 8192 | No | 6752332 | 6432023 | 0.95 |
| 8 | 16384 | No | 10070663 | 9524331 | 0.95 |
| 8 | 32768 | No | 13331928 | 13020697 | 0.98 |
| 8 | 65536 | No | 16155221 | 17072460 | 1.06 |
For more results go to the expandable table below.
Full tabular data for evaluation performance results for DGX A100
| GPUs | Batch size / GPU | XLA | Throughput [samples/s] TF32 | Throughput [samples/s] AMP | Throughput speedup AMP to TF32 |
|---|---|---|---|---|---|
| 1 | 4096 | Yes | 623864 | 634058 | 1.02 |
| 1 | 4096 | No | 594773 | 556904 | 0.94 |
| 1 | 8192 | Yes | 998192 | 1087416 | 1.09 |
| 1 | 8192 | No | 932078 | 919439 | 0.99 |
| 1 | 16384 | Yes | 1491678 | 1617472 | 1.08 |
| 1 | 16384 | No | 1351977 | 1411866 | 1.04 |
| 1 | 32768 | Yes | 1905881 | 2122617 | 1.11 |
| 1 | 32768 | No | 1790851 | 1794104 | 1.00 |
| 1 | 65536 | Yes | 2174949 | 2499589 | 1.15 |
| 1 | 65536 | No | 2101918 | 2263452 | 1.08 |
| 1 | 131072 | Yes | 2493062 | 2852853 | 1.14 |
| 1 | 131072 | No | 2339848 | 2593955 | 1.11 |
| 8 | 4096 | Yes | 4669465 | 4428405 | 0.95 |
| 8 | 4096 | No | 4199683 | 3668578 | 0.87 |
| 8 | 8192 | Yes | 7384089 | 7889794 | 1.07 |
| 8 | 8192 | No | 6752332 | 6432023 | 0.95 |
| 8 | 16384 | Yes | 10275441 | 11451138 | 1.11 |
| 8 | 16384 | No | 10070663 | 9524331 | 0.95 |
| 8 | 32768 | Yes | 13824087 | 15391478 | 1.11 |
| 8 | 32768 | No | 13331928 | 13020697 | 0.98 |
| 8 | 65536 | Yes | 17042737 | 19360812 | 1.14 |
| 8 | 65536 | No | 16155221 | 17072460 | 1.06 |
Evaluation performance: NVIDIA DGX-1 (8x V100 32GB)
Our results were obtained by running the benchmark script (main.py --evaluate --benchmark) in the TensorFlow2 NGC container on NVIDIA DGX-1 with (8x V100 32GB) GPUs.
| GPUs | Batch size / GPU | XLA | Throughput [samples/s] FP32 | Throughput [samples/s] AMP | Throughput speedup AMP to FP32 |
|---|---|---|---|---|---|
| 1 | 4096 | No | 294901 | 337261 | 1.14 |
| 1 | 8192 | No | 431930 | 572204 | 1.32 |
| 1 | 16384 | No | 569286 | 917686 | 1.61 |
| 1 | 32768 | No | 691413 | 1211847 | 1.75 |
| 1 | 65536 | No | 358787 | 1496022 | 4.17 |
| 1 | 131072 | No | 786631 | 1643277 | 2.09 |
| 8 | 4096 | No | 2115851 | 2288038 | 1.08 |
| 8 | 8192 | No | 3226710 | 4223243 | 1.31 |
| 8 | 16384 | No | 4297536 | 6336813 | 1.47 |
| 8 | 32768 | No | 5098699 | 8376428 | 1.64 |
| 8 | 65536 | No | 5310861 | 10377358 | 1.95 |
For more results go to the expandable table below.
Full tabular data for evaluation performance for DGX-1 V100 results
| GPUs | Batch size / GPU | XLA | Throughput [samples/s] FP32 | Throughput [samples/s] AMP | Throughput speedup AMP to FP32 |
|---|---|---|---|---|---|
| 1 | 4096 | Yes | 328428 | 376256 | 1.15 |
| 1 | 4096 | No | 294901 | 337261 | 1.14 |
| 1 | 8192 | Yes | 456681 | 677375 | 1.48 |
| 1 | 8192 | No | 431930 | 572204 | 1.32 |
| 1 | 16384 | Yes | 611507 | 965721 | 1.58 |
| 1 | 16384 | No | 569286 | 917686 | 1.61 |
| 1 | 32768 | Yes | 736865 | 1345174 | 1.83 |
| 1 | 32768 | No | 691413 | 1211847 | 1.75 |
| 1 | 65536 | Yes | 781260 | 1639521 | 2.10 |
| 1 | 65536 | No | 358787 | 1496022 | 4.17 |
| 1 | 131072 | Yes | 428574 | 1809550 | 4.22 |
| 1 | 131072 | No | 786631 | 1643277 | 2.09 |
| 8 | 4096 | Yes | 2368194 | 2750484 | 1.16 |
| 8 | 4096 | No | 2115851 | 2288038 | 1.08 |
| 8 | 8192 | Yes | 3470386 | 4697888 | 1.35 |
| 8 | 8192 | No | 3226710 | 4223243 | 1.31 |
| 8 | 16384 | Yes | 4492971 | 7004571 | 1.56 |
| 8 | 16384 | No | 4297536 | 6336813 | 1.47 |
| 8 | 32768 | Yes | 5257105 | 8916683 | 1.70 |
| 8 | 32768 | No | 5098699 | 8376428 | 1.64 |
| 8 | 65536 | Yes | 5564338 | 11622879 | 2.09 |
| 8 | 65536 | No | 5310861 | 10377358 | 1.95 |