
U-Net allows for seamless segmentation of 2D images, with high accuracy and performance.
The performance measurements in this document were conducted at the time of publication and may not reflect the performance achieved from NVIDIA's latest software release. For the most up-to-date performance measurements, go to NVIDIA Data Center Deep Learning Product Performance.
Benchmarking
The following section shows how to run benchmarks measuring the model performance in training and inference modes.
Training performance benchmark
To benchmark training, run one of the TRAIN_BENCHMARK scripts in ./examples/:
bash examples/unet_TRAIN_BENCHMARK{_TF-AMP}.sh <number/of/gpus> <path/to/dataset> <path/to/checkpoints> <batch/size>
For example, to benchmark training using mixed-precision on 8 GPUs use:
bash examples/unet_TRAIN_BENCHMARK_TF-AMP.sh 8 <path/to/dataset> <path/to/checkpoint> <batch/size>
Each of these scripts will by default run 200 warm-up iterations and benchmark the performance during training in the next 800 iterations.
To have more control, you can run the script by directly providing all relevant run parameters. For example:
horovodrun -np <num of gpus> python main.py --exec_mode train --benchmark --augment --data_dir <path/to/dataset> --model_dir <optional, path/to/checkpoint> --batch_size <batch/size> --warmup_steps <warm-up/steps> --max_steps <max/steps>
At the end of the script, a line reporting the best train throughput will be printed.
Inference performance benchmark
To benchmark inference, run one of the scripts in ./examples/:
bash examples/unet_INFER_BENCHMARK{_TF-AMP}.sh <path/to/dataset> <path/to/checkpoint> <batch/size>
For example, to benchmark inference using mixed-precision:
bash examples/unet_INFER_BENCHMARK_TF-AMP.sh <path/to/dataset> <path/to/checkpoint> <batch/size>
Each of these scripts will by default run 200 warm-up iterations and benchmark the performance during inference in the next 400 iterations.
To have more control, you can run the script by directly providing all relevant run parameters. For example:
python main.py --exec_mode predict --benchmark --data_dir <path/to/dataset> --model_dir <optional, path/to/checkpoint> --batch_size <batch/size> --warmup_steps <warm-up/steps> --max_steps <max/steps>
At the end of the script, a line reporting the best inference throughput will be printed.
Results
The following sections provide details on how we achieved our performance and accuracy in training and inference.
Training accuracy results
Training accuracy: NVIDIA DGX A100 (8x A100 80G)
The following table lists the average DICE score across 5-fold cross-validation. Our results were obtained by running the examples/unet_TRAIN_FULL{_TF-AMP}.sh training script in the tensorflow:21.02-tf2-py3 NGC container on NVIDIA DGX A100 (8x A100 80G) GPUs.
| GPUs | Batch size / GPU | DICE - TF32 | DICE - mixed precision | Time to train - TF32 | Time to train - mixed precision | Time to train speedup (TF32 to mixed precision) |
|---|---|---|---|---|---|---|
| 1 | 8 | 0.8900 | 0.8902 | 21.3 | 8.6 | 2.48 |
| 8 | 8 | 0.8855 | 0.8858 | 2.5 | 2.5 | 1.00 |
Training accuracy: NVIDIA DGX-1 (8x V100 16G)
The following table lists the average DICE score across 5-fold cross-validation. Our results were obtained by running the examples/unet_TRAIN_FULL{_TF-AMP}.sh training script in the tensorflow:21.02-tf2-py3 NGC container on NVIDIA DGX-1 with (8x V100 16G) GPUs.
| GPUs | Batch size / GPU | DICE - FP32 | DICE - mixed precision | Time to train - FP32 [min] | Time to train - mixed precision [min] | Time to train speedup (FP32 to mixed precision) |
|---|---|---|---|---|---|---|
| 1 | 8 | 0.8901 | 0.8898 | 47 | 16 | 2.94 |
| 8 | 8 | 0.8848 | 0.8857 | 7 | 4.5 | 1.56 |
To reproduce this result, start the Docker container interactively and run one of the TRAIN scripts:
bash examples/unet_TRAIN_FULL{_TF-AMP}.sh <number/of/gpus> <path/to/dataset> <path/to/checkpoint> <batch/size>
for example
bash examples/unet_TRAIN_FULL_TF-AMP.sh 8 /data /results 8
This command will launch a script which will run training on 8 GPUs for 6400 iterations five times for 5-fold cross-validation.
At the end, it will collect the scores and print the average validation DICE score and cross-entropy loss.
The time reported is for one fold, which means that the training for 5 folds will take 5 times longer.
The default batch size is 8, however if you have less than 16 Gb memory card and you encounter GPU memory issue you should decrease the batch size.
The logs of the runs can be found in /results directory once the script is finished.
Learning curves
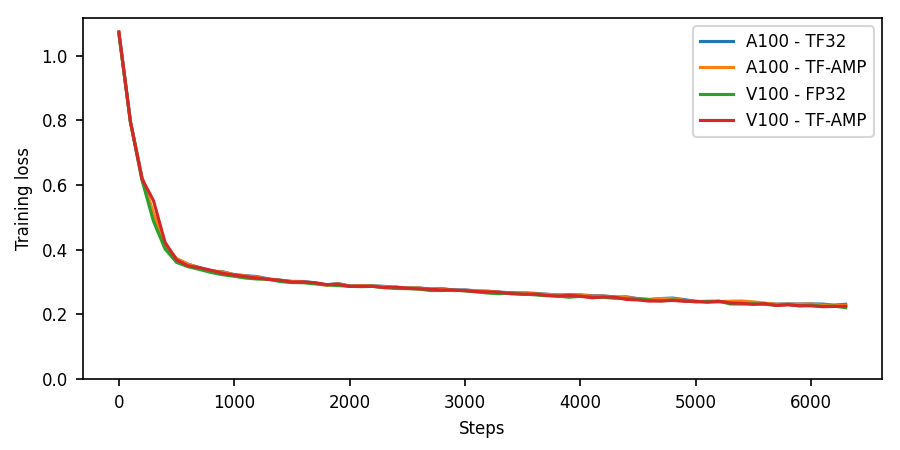
The following image show the training loss as a function of iteration for training using DGX A100 (TF32 and TF-AMP) and DGX-1 V100 (FP32 and TF-AMP).
Training performance results
Training performance: NVIDIA DGX A100 (8x A100 80G)
Our results were obtained by running the examples/unet_TRAIN_BENCHMARK{_TF-AMP}.sh training script in the NGC container on NVIDIA DGX A100 (8x A100 80G) GPUs. Performance numbers (in images per second) were averaged over 1000 iterations, excluding the first 200 warm-up steps.
| GPUs | Batch size / GPU | Throughput - TF32 [img/s] | Throughput - mixed precision [img/s] | Throughput speedup (TF32 - mixed precision) | Weak scaling - TF32 | Weak scaling - mixed precision |
|---|---|---|---|---|---|---|
| 1 | 1 | 46.88 | 75.04 | 1.60 | - | - |
| 1 | 8 | 63.33 | 141.03 | 2.23 | - | - |
| 8 | 1 | 298.91 | 384.27 | 1.29 | 6.37 | 5.12 |
| 8 | 8 | 470.50 | 1000.89 | 2.13 | 7.43 | 7.10 |
Training performance: NVIDIA DGX-1 (8x V100 16G)
Our results were obtained by running the examples/unet_TRAIN_BENCHMARK{_TF-AMP}.sh training script in the tensorflow:21.02-tf2-py3 NGC container on NVIDIA DGX-1 with (8x V100 16G) GPUs. Performance numbers (in images per second) were averaged over 1000 iterations, excluding the first 200 warm-up steps.
| GPUs | Batch size / GPU | Throughput - FP32 [img/s] | Throughput - mixed precision [img/s] | Throughput speedup (FP32 - mixed precision) | Weak scaling - FP32 | Weak scaling - mixed precision |
|---|---|---|---|---|---|---|
| 1 | 1 | 16.92 | 39.63 | 2.34 | - | - |
| 1 | 8 | 19.40 | 60.65 | 3.12 | - | - |
| 8 | 1 | 120.90 | 225.27 | 1.86 | 7.14 | 5.68 |
| 8 | 8 | 137.11 | 419.99 | 3.06 | 7.07 | 6.92 |
To achieve these same results, follow the steps in the Training performance benchmark section.
Throughput is reported in images per second. Latency is reported in milliseconds per image.
TensorFlow 2 runs by default using the eager mode, which makes tensor evaluation trivial at the cost of lower performance. To mitigate this issue multiple layers of performance optimization were implemented. Two of them, AMP and XLA, were already described. There is an additional one called Autograph, which allows to construct a graph from a subset of Python syntax improving the performance simply by adding a @tf.function decorator to the train function. To read more about Autograph see Better performance with tf.function and AutoGraph.
Inference performance results
Inference performance: NVIDIA DGX A100 (1x A100 80G)
Our results were obtained by running the examples/unet_INFER_BENCHMARK{_TF-AMP}.sh inference benchmarking script in the tensorflow:21.02-tf2-py3 NGC container on NVIDIA DGX A100 (1x A100 80G) GPU.
FP16
| Batch size | Resolution | Throughput Avg [img/s] | Latency Avg [ms] | Latency 90% [ms] | Latency 95% [ms] | Latency 99% [ms] |
|---|---|---|---|---|---|---|
| 1 | 572x572x1 | 275.98 | 3.534 | 3.543 | 3.544 | 3.547 |
| 2 | 572x572x1 | 376.68 | 10.603 | 10.619 | 10.623 | 10.629 |
| 4 | 572x572x1 | 443.05 | 19.572 | 19.610 | 19.618 | 19.632 |
| 8 | 572x572x1 | 440.71 | 19.386 | 19.399 | 19.401 | 19.406 |
| 16 | 572x572x1 | 462.79 | 37.760 | 37.783 | 37.788 | 37.797 |
TF32
| Batch size | Resolution | Throughput Avg [img/s] | Latency Avg [ms] | Latency 90% [ms] | Latency 95% [ms] | Latency 99% [ms] |
|---|---|---|---|---|---|---|
| 1 | 572x572x1 | 152.27 | 9.317 | 9.341 | 9.346 | 9.355 |
| 2 | 572x572x1 | 180.84 | 17.294 | 17.309 | 17.312 | 17.318 |
| 4 | 572x572x1 | 203.60 | 31.676 | 31.698 | 31.702 | 31.710 |
| 8 | 572x572x1 | 208.70 | 57.742 | 57.755 | 57.757 | 57.762 |
| 16 | 572x572x1 | 213.15 | 112.545 | 112.562 | 112.565 | 112.572 |
To achieve these same results, follow the steps in the Quick Start Guide.
Inference performance: NVIDIA DGX-1 (1x V100 16G)
Our results were obtained by running the examples/unet_INFER_BENCHMARK{_TF-AMP}.sh inference benchmarking script in the tensorflow:21.02-tf2-py3 NGC container on NVIDIA DGX-1 with (1x V100 16G) GPU.
FP16
| Batch size | Resolution | Throughput Avg [img/s] | Latency Avg [ms] | Latency 90% [ms] | Latency 95% [ms] | Latency 99% [ms] |
|---|---|---|---|---|---|---|
| 1 | 572x572x1 | 142.15 | 10.537 | 6.851 | 6.853 | 6.856 |
| 2 | 572x572x1 | 159.25 | 13.230 | 13.242 | 13.244 | 13.248 |
| 4 | 572x572x1 | 178.19 | 26.035 | 26.049 | 26.051 | 26.057 |
| 8 | 572x572x1 | 188.54 | 43.602 | 43.627 | 43.631 | 43.640 |
| 16 | 572x572x1 | 195.27 | 85.743 | 85.807 | 85.819 | 85.843 |
FP32
| Batch size | Resolution | Throughput Avg [img/s] | Latency Avg [ms] | Latency 90% [ms] | Latency 95% [ms] | Latency 99% [ms] |
|---|---|---|---|---|---|---|
| 1 | 572x572x1 | 51.71 | 20.065 | 20.544 | 20.955 | 21.913 |
| 2 | 572x572x1 | 55.87 | 37.112 | 37.127 | 37.130 | 37.136 |
| 4 | 572x572x1 | 58.15 | 73.033 | 73.068 | 73.074 | 73.087 |
| 8 | 572x572x1 | 59.28 | 144.829 | 144.924 | 144.943 | 144.979 |
| 16 | 572x572x1 | 73.01 | 234.995 | 235.098 | 235.118 | 235.157 |
To achieve these same results, follow the steps in the Inference performance benchmark section.
Throughput is reported in images per second. Latency is reported in milliseconds per batch.