
Transformer-XL is a transformer-based language model with a segment-level recurrence and a novel relative positional encoding.
The performance measurements in this document were conducted at the time of publication and may not reflect the performance achieved from NVIDIA's latest software release. For the most up-to-date performance measurements, go to NVIDIA Data Center Deep Learning Product Performance.
Benchmarking
The following section shows how to run benchmarks measuring the model performance in training and inference modes.
Training performance benchmark
To benchmark the training performance for a specific local (per-gpu) batch size
<LBS>, with a specific number of GPUs <#GPUs> for a specific number of
training iterations <ITER>, run:
bash run_wt103_{base,large}.sh train <#GPUs> --config trainbench --local_batch_size <LBS> --max_step <ITER> [--fp16]
- use the
run_wt103_base.shscript to run the benchmark for the base model, and use therun_wt103_large.shscript to run the benchmark for the large model - it's recommended to launch at least 500 training steps to get a reliable estimate of training performace.
- the
--fp16flag is optional, however, if it's specified, then the script launches mixed precision training with Tensor Cores. If the flag is not present, then the script launches FP32 training on NVIDIA Volta GPUs and TF32 training on NVIDIA Ampere GPUs.
For more information about the available options, refer to the Training process section.
The training script prints information in the following format:
(...)

| epoch   1 step      499 | batches    499 / 16802 | lr 4.990e-03 | ms/batch 219.9 | tok/s   27947 | loss  6.43 | ppl    620.80
| epoch   1 step      500 | batches    500 / 16802 | lr 5.000e-03 | ms/batch 221.4 | tok/s   27747 | loss  6.42 | ppl    611.70
-------------------------------------------------------------------------------
(...)
Training time: 1.81 minutes
Training throughput: 28508.91 tok/s
The last two lines contain information on the total training time and on the average training throughput measured in tokens per second.
Training performance benchmark for multi-node
To benchmark the multi-node training performance of the large model on a
specific number of DGX-2H nodes <NODES> and a specific local batch size
<LBS>, run:
For mixed precision:
FP16=1 LOCAL_BATCH_SIZE=<LBS> CONFIG=trainbench_multinode sbatch -N <NODES> run.sub train
For FP32:
LOCAL_BATCH_SIZE=<LBS> CONFIG=trainbench_multinode sbatch -N <NODES> run.sub train
Inference performance benchmark
The inference performance and accuracy benchmarks require a checkpoint from a trained model.
To benchmark the inference performance on a specific global batch size <BS>
with a specific number of GPUs <#GPUs>, run:
For the base model:
bash run_wt103_base.sh eval <#GPUs> --model <CHECKPOINT> --batch_size <BS> --save_data [--fp16] [--type {pytorch, torchscript}]
For the large model:
bash run_wt103_large.sh eval <#GPUs> --model <CHECKPOINT> --batch_size <BS> --save_data [--fp16] [--type {pytorch, torchscript}]
The inference script prints information in the following format:
Evaluating with math fp16 type torchscript bsz 16 tgt_len 64 ext_len 0 mem_len 640 clamp_len 400
Time : 5.25s, 21.88ms/segment
====================================================================================================

| test loss  3.15 | test ppl    23.304
====================================================================================================
Throughput Avg: 46316.64 tok/s
Latency Avg: 22.09 ms
Latency 90%: 22.22 ms
Latency 95%: 22.25 ms
Latency 99%: 22.37 ms
====================================================================================================
The output contains information on the achieved test loss and test perplexity, average inference throughput (measured in tokens per second), average inference latency and latency at 90%, 95% and 99% confidence intervals (measured in milliseconds).
The scripts/inference_benchmark.sh benchmarking script is provided for
convenience, it automatically launches TF32/FP32 and FP16 inference for various
batch sizes.
Results
The following sections provide details on how we achieved our performance and accuracy in training and inference.
Training accuracy results
Training accuracy: NVIDIA DGX A100 (8x A100 40GB)
Base model
Our results were obtained by running the pytorch/run_wt103_base.sh
training script in the pytorch-20.06-py3 NGC container on NVIDIA DGX A100
with 8x A100 40GB GPUs.
| GPUs | Batch Size / GPU | Accuracy - TF32 (perplexity) | Accuracy - Mixed precision (perplexity) | Time to Train - TF32 (minutes) | Time to Train - Mixed precision (minutes) | Time to Train Speedup (TF32 to Mixed precision) |
|---|---|---|---|---|---|---|
| 8 | 32 | 23.24 | 23.24 | 110 | 76 | 1.45 |
Large model
Our results were obtained by running the pytorch/run_wt103_large.sh
training script in the pytorch-20.06-py3 NGC container on NVIDIA DGX A100
with 8x A100 40GB GPUs.
| GPUs | Batch Size / GPU | Accuracy - TF32 (perplexity) | Accuracy - Mixed precision (perplexity) | Time to Train - TF32 (minutes) | Time to Train - Mixed precision (minutes) | Time to Train Speedup (TF32 to Mixed precision) |
|---|---|---|---|---|---|---|
| 8 | 8 | 18.18 | 18.18 | 735 | 477 | 1.54 |
| 8 | 16 | N/A | 18.19 | N/A | 430 | 1.71 |
Training accuracy: NVIDIA DGX-1 (8x V100 16GB)
Base model
Our results were obtained by running the pytorch/run_wt103_base.sh
training script in the pytorch-20.06-py3 NGC container on NVIDIA DGX-1
with 8x V100 16GB GPUs.
| GPUs | Batch Size / GPU | Accuracy - FP32 (perplexity) | Accuracy - Mixed precision (perplexity) | Time to Train - FP32 (minutes) | Time to Train - Mixed precision (minutes) | Time to Train Speedup (FP32 to Mixed precision) |
|---|---|---|---|---|---|---|
| 1 | 16 | 23.12 | 23.13 | 2146 | 960 | 2.24 |
| 8 | 16 | 23.17 | 23.14 | 316 | 167 | 1.89 |
| 1 | 32 | N/A | 23.15 | N/A | 766 | 2.80 |
| 8 | 32 | N/A | 23.18 | N/A | 121 | 2.61 |
Large model
Our results were obtained by running the pytorch/run_wt103_large.sh
training script in the pytorch-20.06-py3 NGC container on NVIDIA DGX-1
with 8x V100 16GB GPUs.
| GPUs | Batch Size / GPU | Accuracy - FP32 (perplexity) | Accuracy - Mixed precision (perplexity) | Time to Train - FP32 (minutes) | Time to Train - Mixed precision (minutes) | Time to Train Speedup (FP32 to Mixed precision) |
|---|---|---|---|---|---|---|
| 8 | 2 | 18.22 | 18.20 | 2983 | 1480 | 2.01 |
| 8 | 4 | N/A | 18.17 | N/A | 984 | 3.03 |
Training accuracy: NVIDIA DGX-2H (16x V100 32GB)
Base model
Our results were obtained by running the pytorch/run_wt103_base.sh
training script in the pytorch-20.06-py3 NGC container on NVIDIA DGX-2H
with 16x V100 32GB GPUs.
| GPUs | Batch Size / GPU | Accuracy - FP32 (perplexity) | Accuracy - Mixed precision (perplexity) | Time to Train - FP32 (minutes) | Time to Train - Mixed precision (minutes) | Time to Train Speedup (FP32 to Mixed precision) |
|---|---|---|---|---|---|---|
| 16 | 16 | 23.22 | 23.22 | 149 | 80 | 1.86 |
Large model
Our results were obtained by running the pytorch/run_wt103_large.sh
training script in the pytorch-20.06-py3 NGC container on NVIDIA DGX-2H
with 16x V100 32GB GPUs.
| GPUs | Batch Size / GPU | Accuracy - FP32 (perplexity) | Accuracy - Mixed precision (perplexity) | Time to Train - FP32 (minutes) | Time to Train - Mixed precision (minutes) | Time to Train Speedup (FP32 to Mixed precision) |
|---|---|---|---|---|---|---|
| 16 | 8 | 18.21 | 18.20 | 1075 | 394 | 2.73 |
Training accuracy: 8x NVIDIA DGX-2H (16x V100 32GB)
Large model
Our results were obtained by running the pytorch/run.sub
training script in the pytorch-20.06-py3 NGC container on 8x NVIDIA DGX-2H
with 16x V100 32GB GPUs.
| DGX System | Nodes | Batch Size / GPU | Accuracy - FP32 (perplexity) | Accuracy - Mixed precision (perplexity) | Time to Train - FP32 (minutes) | Time to Train - Mixed precision (minutes) | Time to Train Speedup (FP32 to Mixed precision) |
|---|---|---|---|---|---|---|---|
| DGX-2H | 8 | 4 | 18.27 | 18.28 | 156 | 74 | 2.11 |
Training accuracy plots
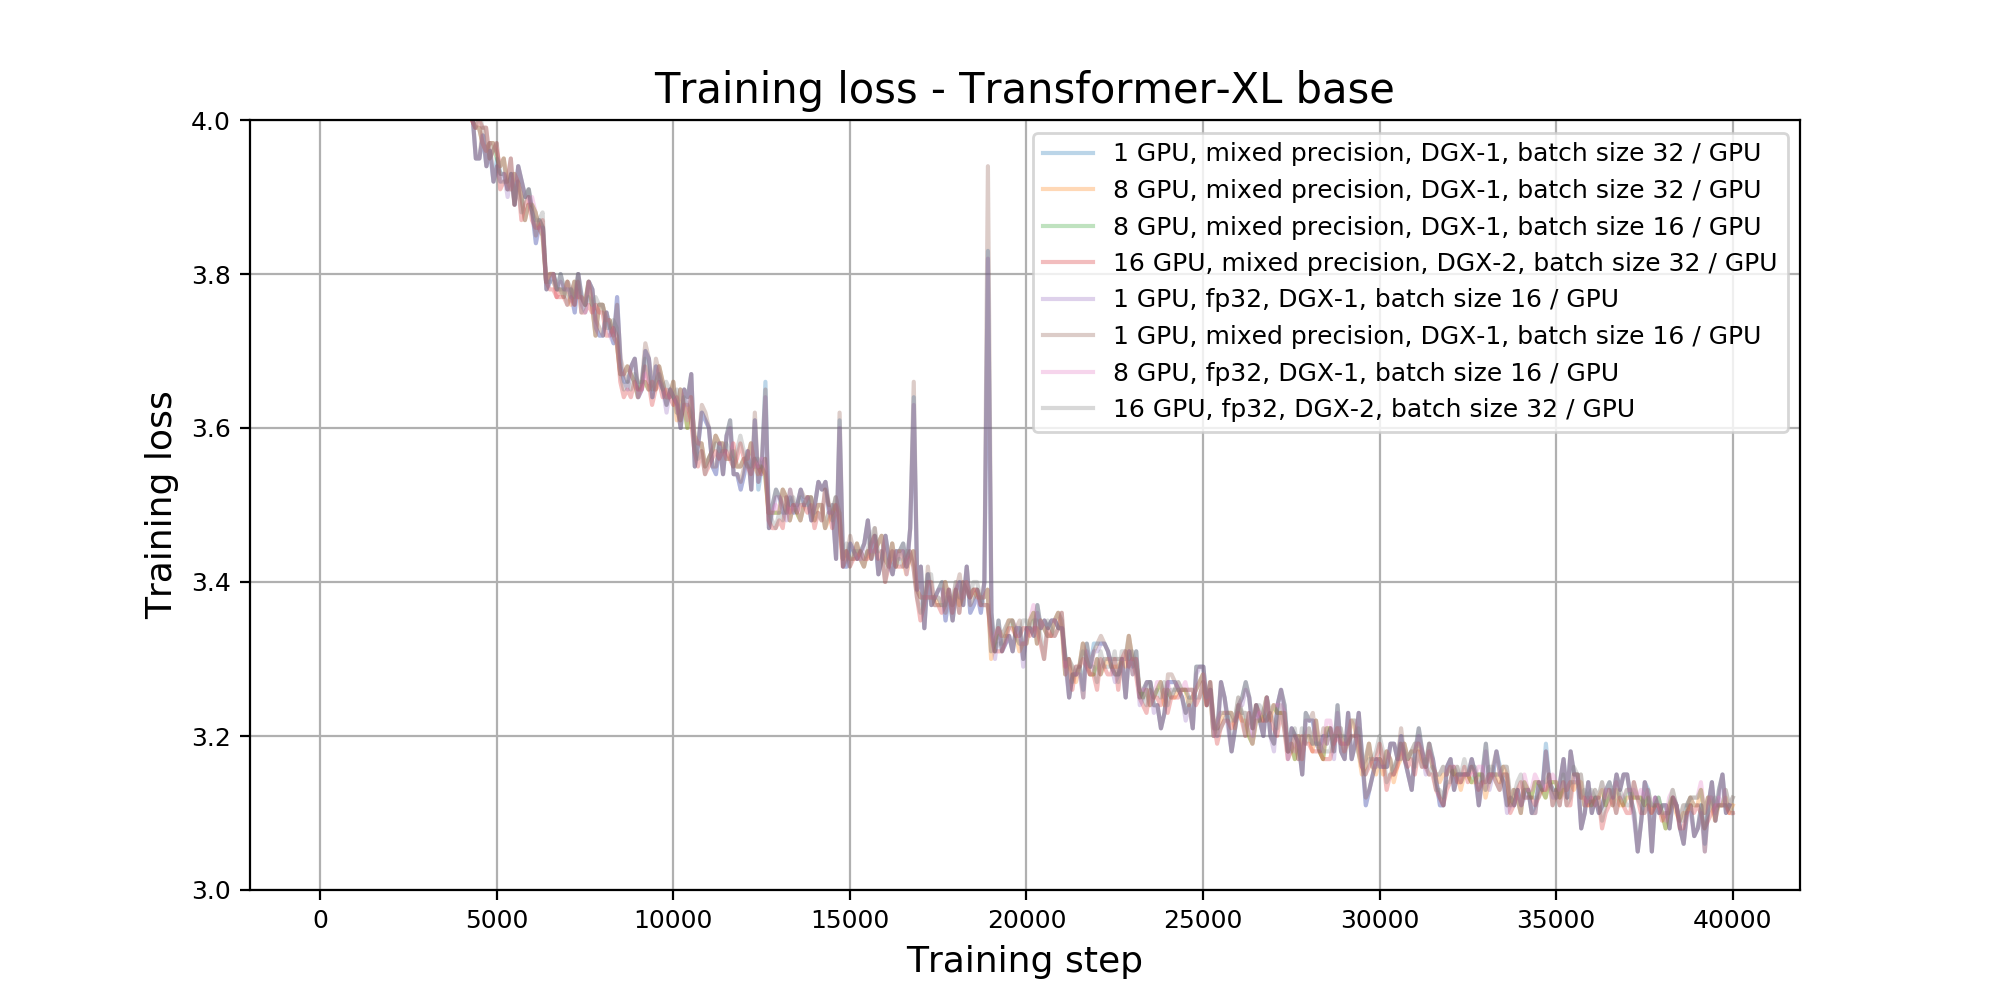
Base model
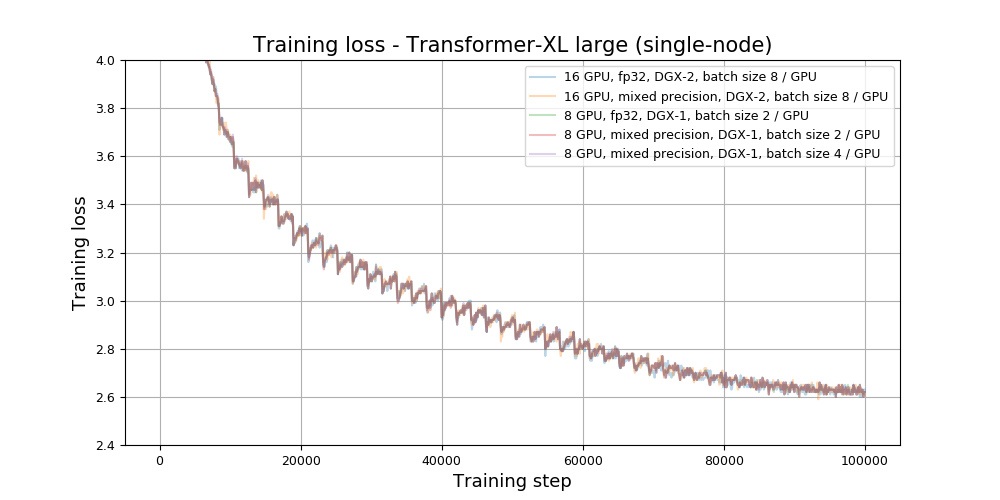
Large model (single-node)
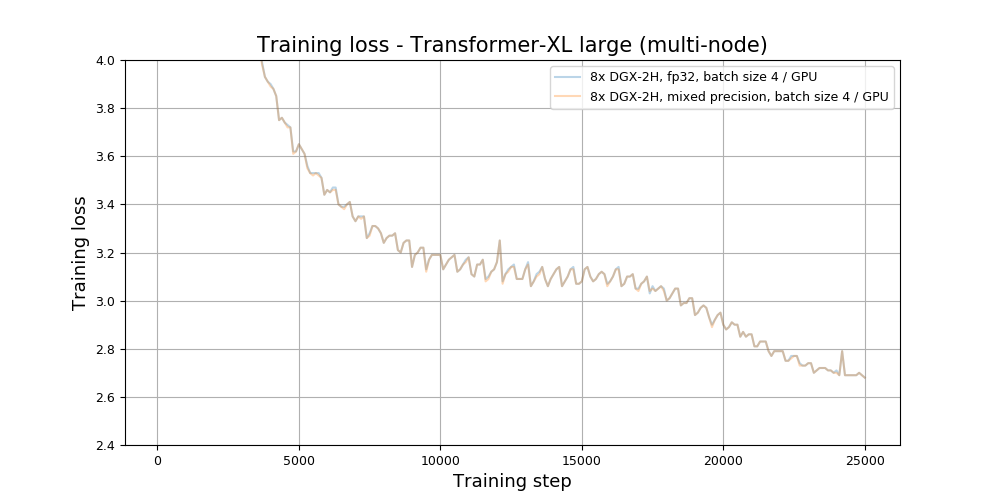
Large model (multi-node)
Training stability test
Base model
The Transformer-XL base model was trained for 40,000 training steps, starting from 16 different initial random seeds. After every 5,000 training steps, the model was evaluated on the validation dataset and validation perplexity was recorded. The training was performed in the pytorch-20.06-py3 NGC container on NVIDIA DGX A100 with 8x A100 40GB GPUs. The following table summarizes the perplexity of our validation dataset.
| Training step | Average perplexity | Standard deviation | Minimum | Maximum | Median |
|---|---|---|---|---|---|
| 5000 | 42.62 | 0.27311 | 42.01 | 43.09 | 42.67 |
| 10000 | 32.31 | 0.12814 | 32.10 | 32.59 | 32.31 |
| 15000 | 28.38 | 0.10764 | 28.23 | 28.57 | 28.35 |
| 20000 | 26.14 | 0.10218 | 25.96 | 26.36 | 26.14 |
| 25000 | 24.59 | 0.09060 | 24.42 | 24.81 | 24.60 |
| 30000 | 23.71 | 0.07259 | 23.61 | 23.84 | 23.71 |
| 35000 | 23.15 | 0.04781 | 23.05 | 23.26 | 23.15 |
| 40000 | 22.93 | 0.05593 | 22.83 | 23.04 | 22.94 |
After training, the models were evaluated on the test dataset. The following table summarizes the final perplexity on the test set.
| Average perplexity | Standard deviation | Minimum | Maximum | Median |
|---|---|---|---|---|
| 23.24 | 0.07794 | 23.11 | 23.38 | 23.25 |
Large model (single-node)
The Transformer-XL large model was trained for 100,000 training steps, starting from 16 different initial random seeds. After every 10,000 training steps, the model was evaluated on the validation dataset and validation perplexity was recorded. The training was performed in the pytorch-20.06-py3 NGC container on NVIDIA DGX A100 with 8x A100 40GB GPUs. The following table summarizes the perplexity of our validation dataset.
| Training step | Average perplexity | Standard deviation | Minimum | Maximum | Median |
|---|---|---|---|---|---|
| 10000 | 32.63 | 0.20432 | 32.34 | 33.05 | 32.62 |
| 20000 | 24.08 | 0.10980 | 23.90 | 24.28 | 24.10 |
| 30000 | 21.52 | 0.09069 | 21.36 | 21.66 | 21.52 |
| 40000 | 20.17 | 0.06922 | 20.06 | 20.27 | 20.17 |
| 50000 | 19.23 | 0.05975 | 19.11 | 19.33 | 19.24 |
| 60000 | 18.57 | 0.06008 | 18.47 | 18.72 | 18.56 |
| 70000 | 18.17 | 0.06473 | 18.08 | 18.32 | 18.15 |
| 80000 | 17.95 | 0.06506 | 17.82 | 18.08 | 17.94 |
| 90000 | 17.80 | 0.04350 | 17.71 | 17.90 | 17.80 |
| 100000 | 17.80 | 0.03592 | 17.74 | 17.86 | 17.81 |
After training, the models were evaluated on the test dataset. The following table summarizes the final perplexity on the test set.
| Average perplexity | Standard deviation | Minimum | Maximum | Median |
|---|---|---|---|---|
| 18.17 | 0.04016 | 18.09 | 18.24 | 18.17 |
Large model (multi-node)
The Transformer-XL large model was trained for 25,000 training steps, starting from 10 different initial random seeds. After every 1,000 training steps, the model was evaluated on the validation dataset and validation perplexity was recorded. The training was performed in the pytorch-20.06-py3 NGC container on 8x NVIDIA DGX-2H with 16x V100 32GB GPUs. The following table summarizes the perplexity of our validation dataset.
| Training step | Average perplexity | Standard deviation | Minimum | Maximum | Median |
|---|---|---|---|---|---|
| 1000 | 608.09 | 3.80116 | 600.65 | 613.73 | 609.40 |
| 2000 | 142.75 | 0.94452 | 141.21 | 143.84 | 143.07 |
| 3000 | 62.19 | 0.44544 | 61.38 | 63.01 | 62.18 |
| 4000 | 40.22 | 0.16397 | 39.93 | 40.54 | 40.20 |
| 5000 | 32.00 | 0.15850 | 31.61 | 32.19 | 32.02 |
| 6000 | 28.05 | 0.17854 | 27.81 | 28.41 | 28.05 |
| 7000 | 25.65 | 0.10946 | 25.51 | 25.87 | 25.65 |
| 8000 | 24.20 | 0.11385 | 23.98 | 24.36 | 24.20 |
| 9000 | 23.18 | 0.14936 | 22.84 | 23.37 | 23.20 |
| 10000 | 22.88 | 0.22752 | 22.54 | 23.33 | 22.94 |
| 11000 | 21.99 | 0.16232 | 21.73 | 22.29 | 21.97 |
| 12000 | 21.69 | 0.10824 | 21.46 | 21.81 | 21.73 |
| 13000 | 21.42 | 0.09154 | 21.25 | 21.57 | 21.44 |
| 14000 | 21.33 | 0.13821 | 21.15 | 21.55 | 21.27 |
| 15000 | 21.24 | 0.15526 | 20.95 | 21.57 | 21.20 |
| 16000 | 21.19 | 0.10521 | 21.01 | 21.44 | 21.18 |
| 17000 | 20.89 | 0.18239 | 20.69 | 21.18 | 20.82 |
| 18000 | 20.36 | 0.10715 | 20.21 | 20.53 | 20.34 |
| 19000 | 19.74 | 0.12803 | 19.45 | 19.92 | 19.75 |
| 20000 | 19.18 | 0.10020 | 19.05 | 19.39 | 19.15 |
| 21000 | 18.49 | 0.06319 | 18.36 | 18.60 | 18.49 |
| 22000 | 18.17 | 0.03674 | 18.11 | 18.22 | 18.16 |
| 23000 | 17.98 | 0.03682 | 17.90 | 18.04 | 17.99 |
| 24000 | 17.88 | 0.02880 | 17.84 | 17.92 | 17.89 |
| 25000 | 17.85 | 0.02793 | 17.80 | 17.90 | 17.86 |
After training, the models were evaluated on the test dataset. The following table summarizes the final perplexity on the test set.
| Average perplexity | Standard deviation | Minimum | Maximum | Median |
|---|---|---|---|---|
| 18.30 | 0.02747 | 18.24 | 18.33 | 18.30 |
Training performance results
Training performance: NVIDIA DGX A100 (8x A100 40GB)
Base model
Our results were obtained by running the pytorch/run_wt103_base.sh training
script in the pytorch-20.06-py3 NGC container on NVIDIA DGX A100 with 8x A100
40GB GPUs. Performance numbers (in tokens per second) were averaged over 500
training iterations.
| GPUs | Batch Size / GPU | Throughput - TF32 (tok/s) | Throughput - Mixed precision (tok/s) | Throughput speedup (TF32 to Mixed precision) | Weak Scaling - TF32 | Weak Scaling - Mixed precision |
|---|---|---|---|---|---|---|
| 1 | 32 | 41,527 | 59,961 | 1.444 | 1.000 | 1.000 |
| 2 | 32 | 77,625 | 113,238 | 1.459 | 1.869 | 1.889 |
| 4 | 32 | 153,945 | 225,609 | 1.466 | 3.707 | 3.763 |
| 8 | 32 | 305,933 | 449,890 | 1.471 | 7.367 | 7.503 |
To achieve these same results, follow the steps in the Quick Start Guide to download the dataset and setup the container, and then proceed to the Training performance benchmark section for instruction on how to launch the benchmark.
Large model
Our results were obtained by running the pytorch/run_wt103_large.sh training
script in the pytorch-20.06-py3 NGC container on NVIDIA DGX A100 with 8x A100
40GB GPUs. Performance numbers (in tokens per second) were averaged over 500
training iterations.
| GPUs | Batch Size / GPU | Throughput - TF32 (tok/s) | Throughput - Mixed precision (tok/s) | Throughput speedup (TF32 to Mixed precision) | Weak Scaling - TF32 | Weak Scaling - Mixed precision |
|---|---|---|---|---|---|---|
| 1 | 8 | 14,497 | 21,554 | 1.487 | 1.000 | 1.000 |
| 2 | 8 | 27,304 | 40,222 | 1.473 | 1.883 | 1.866 |
| 4 | 8 | 53,756 | 80,226 | 1.492 | 3.708 | 3.722 |
| 8 | 8 | 106,651 | 159,185 | 1.493 | 7.357 | 7.385 |
| 1 | 16 | N/A | 25,084 | 1.730 | N/A | 1.000 |
| 2 | 16 | N/A | 48,562 | 1.779 | N/A | 1.936 |
| 4 | 16 | N/A | 95,997 | 1.786 | N/A | 3.827 |
| 8 | 16 | N/A | 191,148 | 1.792 | N/A | 7.620 |
To achieve these same results, follow the steps in the Quick Start Guide to download the dataset and setup the container, and then proceed to the Training performance benchmark section for instruction on how to launch the benchmark.
Training performance: NVIDIA DGX-1 (8x V100 16GB)
Base model
Our results were obtained by running the pytorch/run_wt103_base.sh training
script in the pytorch-20.06-py3 NGC container on NVIDIA DGX-1 with 8x V100 16GB
GPUs. Performance numbers (in tokens per second) were averaged over 500
training iterations.
| GPUs | Batch Size / GPU | Throughput - FP32 (tok/s) | Throughput - Mixed precision (tok/s) | Throughput speedup (FP32 to Mixed precision) | Weak Scaling - FP32 | Weak Scaling - Mixed precision |
|---|---|---|---|---|---|---|
| 1 | 16 | 13,981 | 26,639 | 1.905 | 1.000 | 1.000 |
| 2 | 16 | 23,163 | 45,299 | 1.956 | 1.657 | 1.700 |
| 4 | 16 | 48,893 | 92,618 | 1.894 | 3.497 | 3.477 |
| 8 | 16 | 97,005 | 170,532 | 1.758 | 6.938 | 6.402 |
| 1 | 32 | N/A | 36,692 | 2.624 | N/A | 1.000 |
| 2 | 32 | N/A | 65,889 | 2.845 | N/A | 1.796 |
| 4 | 32 | N/A | 133,838 | 2.737 | N/A | 3.648 |
| 8 | 32 | N/A | 258,648 | 2.666 | N/A | 7.049 |
To achieve these same results, follow the steps in the Quick Start Guide to download the dataset and setup the container, and then proceed to the Training performance benchmark section for instruction on how to launch the benchmark.
Large model
Our results were obtained by running the pytorch/run_wt103_large.sh training
script in the pytorch-20.06-py3 NGC container on NVIDIA DGX-1 with 8x V100 16GB
GPUs. Performance numbers (in tokens per second) were averaged over 500
training iterations.
| GPUs | Batch Size / GPU | Throughput - FP32 (tok/s) | Throughput - Mixed precision (tok/s) | Throughput speedup (FP32 to Mixed precision) | Weak Scaling - FP32 | Weak Scaling - Mixed precision |
|---|---|---|---|---|---|---|
| 1 | 2 | 3,558 | 6,907 | 1.941 | 1.000 | 1.000 |
| 2 | 2 | 6,153 | 11,272 | 1.832 | 1.729 | 1.632 |
| 4 | 2 | 12,492 | 22,530 | 1.804 | 3.511 | 3.262 |
| 8 | 2 | 24,595 | 40,920 | 1.664 | 6.913 | 5.925 |
| 1 | 4 | N/A | 10,210 | 2.870 | N/A | 1.000 |
| 2 | 4 | N/A | 17,984 | 2.923 | N/A | 1.761 |
| 4 | 4 | N/A | 36,340 | 2.909 | N/A | 3.559 |
| 8 | 4 | N/A | 66,716 | 2.713 | N/A | 6.535 |
To achieve these same results, follow the steps in the Quick Start Guide to download the dataset and setup the container, and then proceed to the Training performance benchmark section for instruction on how to launch the benchmark.
Training performance: NVIDIA DGX-2H (16x V100 32GB)
Base model
Our results were obtained by running the pytorch/run_wt103_base.sh training
script in the pytorch-20.06-py3 NGC container on NVIDIA DGX-2H with 16x V100
32GB GPUs. Performance numbers (in tokens per second) were averaged over 500
training iterations.
| GPUs | Batch Size / GPU | Throughput - FP32 (tok/s) | Throughput - Mixed precision (tok/s) | Throughput speedup (FP32 to Mixed precision) | Weak Scaling - FP32 | Weak Scaling - Mixed precision |
|---|---|---|---|---|---|---|
| 1 | 16 | 16,150 | 32,875 | 2.036 | 1.000 | 1.000 |
| 2 | 16 | 29,712 | 59,058 | 1.988 | 1.840 | 1.796 |
| 4 | 16 | 58,011 | 113,985 | 1.965 | 3.592 | 3.467 |
| 8 | 16 | 114,655 | 223,907 | 1.953 | 7.099 | 6.811 |
| 16 | 16 | 222,920 | 414,994 | 1.862 | 13.803 | 12.623 |
To achieve these same results, follow the steps in the Quick Start Guide to download the dataset and setup the container, and then proceed to the Training performance benchmark section for instruction on how to launch the benchmark.
Large model
Our results were obtained by running the pytorch/run_wt103_large.sh training
script in the pytorch-20.06-py3 NGC container on NVIDIA DGX-2H with 16x V100
32GB GPUs. Performance numbers (in tokens per second) were averaged over 500
training iterations.
| GPUs | Batch Size / GPU | Throughput - FP32 (tok/s) | Throughput - Mixed precision (tok/s) | Throughput speedup (FP32 to Mixed precision) | Weak Scaling - FP32 | Weak Scaling - Mixed precision |
|---|---|---|---|---|---|---|
| 1 | 8 | 5,169 | 14,787 | 2.861 | 1.000 | 1.000 |
| 2 | 8 | 9,977 | 27,710 | 2.777 | 1.930 | 1.874 |
| 4 | 8 | 19,691 | 54,207 | 2.753 | 3.810 | 3.666 |
| 8 | 8 | 39,157 | 107,073 | 2.734 | 7.576 | 7.241 |
| 16 | 8 | 77,568 | 211,387 | 2.725 | 15.008 | 14.296 |
To achieve these same results, follow the steps in the Quick Start Guide to download the dataset and setup the container, and then proceed to the Training performance benchmark section for instruction on how to launch the benchmark.
Training performance: 8x NVIDIA DGX-2H (16x V100 32GB)
Our results were obtained by running the pytorch/run.sub training script in
the pytorch-20.06-py3 NGC container. Performance numbers (in tokens per second)
were averaged over 500 training iterations.
Large model
| DGX System | Nodes | Batch Size / GPU | Throughput - FP32 (tok/s) | Throughput - Mixed precision (tok/s) | Throughput speedup (FP32 to Mixed precision) | Weak Scaling - FP32 | Weak scaling - Mixed precision |
|---|---|---|---|---|---|---|---|
| DGX-2H | 1 | 4 | 69,070 | 154,950 | 2.24 | 1.00 | 1.00 |
| DGX-2H | 2 | 4 | 136,960 | 307,520 | 2.25 | 1.98 | 1.98 |
| DGX-2H | 4 | 4 | 270,120 | 605,530 | 2.24 | 3.91 | 3.91 |
| DGX-2H | 8 | 4 | 514,500 | 1,189,700 | 2.31 | 7.45 | 7.68 |
To achieve these same results, follow the steps in the
Quick Start Guide to download the dataset and then
proceed to the
Training performance benchmark for
multi-node section for
instruction on how to launch the multi-node performance benchmark. The numbers
presented above were obtained with LOCAL_BATCH_SIZE=4.
Inference performance results
Inference performance: NVIDIA DGX A100 (1x A100 40GB)
Base model
Our results were obtained by running the
pytorch/scripts/inference_benchmark.sh inferencing benchmarking script in the
pytorch-20.06-py3 NGC container on NVIDIA DGX A100 with 1x A100 40GB GPU.
The command to launch the inference performance benchmark is provided in the Inference performance benchmark section.
FP16, pure Python
| Batch size | Sequence length | Memory length | Throughput Avg (tok/s) | Latency Avg (ms) | Latency 90% (ms) | Latency 95% (ms) | Latency 99% (ms) |
|---|---|---|---|---|---|---|---|
| 1 | 64 | 640 | 4,163.7 | 15.38 | 15.58 | 15.66 | 16.12 |
| 2 | 64 | 640 | 7,915.4 | 16.17 | 16.36 | 16.42 | 17.19 |
| 4 | 64 | 640 | 15,710.2 | 16.29 | 16.45 | 16.49 | 17.38 |
| 8 | 64 | 640 | 32,712.1 | 15.64 | 15.77 | 15.82 | 16.65 |
| 16 | 64 | 640 | 59,378.6 | 17.23 | 17.32 | 17.36 | 18.39 |
| 32 | 64 | 640 | 91,654.2 | 22.33 | 22.39 | 22.53 | 23.63 |
FP16, TorchScript
| Batch size | Sequence length | Memory length | Throughput Avg (tok/s) | Latency Avg (ms) | Latency 90% (ms) | Latency 95% (ms) | Latency 99% (ms) |
|---|---|---|---|---|---|---|---|
| 1 | 64 | 640 | 6,935.9 | 9.231 | 9.388 | 9.445 | 9.534 |
| 2 | 64 | 640 | 12,649.4 | 10.120 | 10.253 | 10.294 | 10.945 |
| 4 | 64 | 640 | 25,029.5 | 10.223 | 10.346 | 10.381 | 10.475 |
| 8 | 64 | 640 | 52,666.3 | 9.716 | 9.808 | 9.851 | 10.540 |
| 16 | 64 | 640 | 90,767.8 | 11.274 | 11.321 | 11.334 | 11.800 |
| 32 | 64 | 640 | 107,082.4 | 19.109 | 19.138 | 19.162 | 19.608 |
TF32, pure Python
| Batch size | Sequence length | Memory length | Throughput Avg (tok/s) | Latency Avg (ms) | Latency 90% (ms) | Latency 95% (ms) | Latency 99% (ms) |
|---|---|---|---|---|---|---|---|
| 1 | 64 | 640 | 4,003.8 | 15.99 | 16.26 | 16.36 | 16.58 |
| 2 | 64 | 640 | 7,499.2 | 17.07 | 17.32 | 17.39 | 17.86 |
| 4 | 64 | 640 | 14,835.4 | 17.25 | 17.46 | 17.50 | 18.34 |
| 8 | 64 | 640 | 30,001.5 | 17.06 | 17.22 | 17.28 | 18.40 |
| 16 | 64 | 640 | 50,189.7 | 20.39 | 20.48 | 20.52 | 21.41 |
| 32 | 64 | 640 | 63,660.5 | 32.14 | 32.17 | 32.29 | 33.19 |
TF32, TorchScript
| Batch size | Sequence length | Memory length | Throughput Avg (tok/s) | Latency Avg (ms) | Latency 90% (ms) | Latency 95% (ms) | Latency 99% (ms) |
|---|---|---|---|---|---|---|---|
| 1 | 64 | 640 | 6,084.5 | 10.52 | 10.74 | 10.84 | 10.95 |
| 2 | 64 | 640 | 11,680.6 | 10.96 | 11.17 | 11.22 | 11.76 |
| 4 | 64 | 640 | 22,867.3 | 11.19 | 11.35 | 11.40 | 12.07 |
| 8 | 64 | 640 | 45,165.5 | 11.33 | 11.46 | 11.49 | 12.03 |
| 16 | 64 | 640 | 61,042.0 | 16.76 | 16.84 | 16.86 | 17.13 |
| 32 | 64 | 640 | 71,124.1 | 28.77 | 28.81 | 28.84 | 28.86 |
To achieve these same results, follow the steps in the Quick Start Guide to download the dataset and setup the container, and then proceed to the Inference performance benchmark section for instruction on how to launch the benchmark.
Large model
Our results were obtained by running the
pytorch/scripts/inference_benchmark.sh inferencing benchmarking script in the
pytorch-20.06-py3 NGC container on NVIDIA DGX A100 with 1x A100 40GB GPU.
The command to launch the inference performance benchmark is provided in the Inference performance benchmark section.
FP16, pure Python
| Batch size | Sequence length | Memory length | Throughput Avg (tok/s) | Latency Avg (ms) | Latency 90% (ms) | Latency 95% (ms) | Latency 99% (ms) |
|---|---|---|---|---|---|---|---|
| 1 | 128 | 1,600 | 7,033.0 | 18.20 | 18.57 | 18.64 | 18.93 |
| 2 | 128 | 1,600 | 12,832.5 | 19.94 | 20.23 | 20.29 | 21.07 |
| 4 | 128 | 1,600 | 21,500.2 | 23.80 | 23.99 | 24.07 | 25.09 |
| 8 | 128 | 1,600 | 25,797.1 | 39.66 | 39.74 | 39.91 | 41.00 |
| 16 | 128 | 1,600 | 28,143.5 | 72.71 | 72.74 | 73.12 | 74.00 |
| 32 | 128 | 1,600 | 28,533.6 | 143.44 | 143.30 | 143.48 | 149.07 |
FP16, TorchScript
| Batch size | Sequence length | Memory length | Throughput Avg (tok/s) | Latency Avg (ms) | Latency 90% (ms) | Latency 95% (ms) | Latency 99% (ms) |
|---|---|---|---|---|---|---|---|
| 1 | 128 | 1,600 | 11,068.2 | 11.57 | 11.83 | 11.88 | 12.42 |
| 2 | 128 | 1,600 | 19,847.0 | 12.89 | 13.09 | 13.11 | 13.27 |
| 4 | 128 | 1,600 | 24,450.7 | 20.92 | 21.08 | 21.10 | 21.15 |
| 8 | 128 | 1,600 | 27,938.4 | 36.62 | 36.72 | 36.75 | 36.86 |
| 16 | 128 | 1,600 | 30,783.0 | 66.48 | 66.54 | 66.59 | 66.98 |
| 32 | 128 | 1,600 | 32,161.6 | 127.26 | 127.19 | 127.34 | 131.64 |
TF32, pure Python
| Batch size | Sequence length | Memory length | Throughput Avg (tok/s) | Latency Avg (ms) | Latency 90% (ms) | Latency 95% (ms) | Latency 99% (ms) |
|---|---|---|---|---|---|---|---|
| 1 | 128 | 1,600 | 6,558.8 | 19.52 | 19.87 | 19.95 | 20.44 |
| 2 | 128 | 1,600 | 10,658.4 | 24.00 | 24.28 | 24.36 | 25.17 |
| 4 | 128 | 1,600 | 14,769.6 | 34.64 | 34.82 | 34.89 | 35.74 |
| 8 | 128 | 1,600 | 16,852.6 | 60.71 | 60.82 | 61.05 | 62.17 |
| 16 | 128 | 1,600 | 18,071.8 | 113.23 | 113.28 | 113.37 | 114.64 |
| 32 | 128 | 1,600 | 17,619.2 | 234.04 | 229.98 | 239.30 | 328.15 |
TF32, TorchScript
| Batch size | Sequence length | Memory length | Throughput Avg (tok/s) | Latency Avg (ms) | Latency 90% (ms) | Latency 95% (ms) | Latency 99% (ms) |
|---|---|---|---|---|---|---|---|
| 1 | 128 | 1,600 | 9,084.4 | 14.09 | 14.37 | 14.40 | 14.46 |
| 2 | 128 | 1,600 | 12,839.4 | 19.92 | 20.15 | 20.17 | 20.25 |
| 4 | 128 | 1,600 | 15,582.4 | 32.83 | 33.00 | 33.02 | 33.28 |
| 8 | 128 | 1,600 | 17,825.0 | 57.40 | 57.55 | 57.59 | 57.94 |
| 16 | 128 | 1,600 | 19,419.2 | 105.38 | 105.49 | 105.54 | 105.91 |
| 32 | 128 | 1,600 | 20,079.4 | 203.81 | 203.77 | 203.84 | 207.47 |
To achieve these same results, follow the steps in the Quick Start Guide to download the dataset and setup the container, and then proceed to the Inference performance benchmark section for instruction on how to launch the benchmark.
Inference performance: NVIDIA DGX-1 (1x V100 16GB)
Base model
Our results were obtained by running the
pytorch/scripts/inference_benchmark.sh inferencing benchmarking script in the
pytorch-20.06-py3 NGC container on NVIDIA DGX-1 with 1x V100 16GB GPU.
The command to launch the inference performance benchmark is provided in the Inference performance benchmark section.
FP16, pure Python
| Batch size | Sequence length | Memory length | Throughput Avg (tok/s) | Latency Avg (ms) | Latency 90% (ms) | Latency 95% (ms) | Latency 99% (ms) |
|---|---|---|---|---|---|---|---|
| 1 | 64 | 640 | 2,999.6 | 21.36 | 21.72 | 21.90 | 24.86 |
| 2 | 64 | 640 | 5,738.5 | 22.32 | 22.64 | 22.89 | 25.97 |
| 4 | 64 | 640 | 11,773.5 | 21.73 | 21.92 | 22.06 | 22.68 |
| 8 | 64 | 640 | 22,604.7 | 22.63 | 22.92 | 23.08 | 23.56 |
| 16 | 64 | 640 | 41,481.6 | 24.67 | 24.83 | 24.99 | 25.73 |
| 32 | 64 | 640 | 58,556.9 | 34.95 | 35.13 | 35.24 | 35.85 |
FP16, TorchScript
| Batch size | Sequence length | Memory length | Throughput Avg (tok/s) | Latency Avg (ms) | Latency 90% (ms) | Latency 95% (ms) | Latency 99% (ms) |
|---|---|---|---|---|---|---|---|
| 1 | 64 | 640 | 5,199.9 | 12.31 | 12.59 | 12.65 | 12.98 |
| 2 | 64 | 640 | 9,802.5 | 13.06 | 13.30 | 13.42 | 13.82 |
| 4 | 64 | 640 | 19,609.4 | 13.05 | 13.17 | 13.24 | 13.94 |
| 8 | 64 | 640 | 37,598.7 | 13.61 | 13.71 | 13.77 | 14.62 |
| 16 | 64 | 640 | 57,840.2 | 17.69 | 17.73 | 17.76 | 18.36 |
| 32 | 64 | 640 | 66,955.9 | 30.57 | 30.78 | 30.86 | 30.96 |
FP32, pure Python
| Batch size | Sequence length | Memory length | Throughput Avg (tok/s) | Latency Avg (ms) | Latency 90% (ms) | Latency 95% (ms) | Latency 99% (ms) |
|---|---|---|---|---|---|---|---|
| 1 | 64 | 640 | 2,940.0 | 21.79 | 22.23 | 22.42 | 25.52 |
| 2 | 64 | 640 | 5,652.0 | 22.66 | 23.00 | 23.20 | 26.86 |
| 4 | 64 | 640 | 10,526.0 | 24.30 | 24.62 | 24.72 | 25.03 |
| 8 | 64 | 640 | 15,767.2 | 32.45 | 32.67 | 32.78 | 33.32 |
| 16 | 64 | 640 | 20,303.2 | 50.39 | 50.82 | 50.89 | 51.07 |
| 32 | 64 | 640 | 21,707.1 | 94.26 | 94.76 | 94.94 | 95.26 |
FP32, TorchScript
| Batch size | Sequence length | Memory length | Throughput Avg (tok/s) | Latency Avg (ms) | Latency 90% (ms) | Latency 95% (ms) | Latency 99% (ms) |
|---|---|---|---|---|---|---|---|
| 1 | 64 | 640 | 4,974.1 | 12.88 | 13.25 | 13.37 | 13.69 |
| 2 | 64 | 640 | 9,625.3 | 13.30 | 13.58 | 13.72 | 14.15 |
| 4 | 64 | 640 | 15,069.9 | 16.98 | 17.27 | 17.35 | 17.54 |
| 8 | 64 | 640 | 18,269.8 | 28.00 | 28.23 | 28.28 | 28.37 |
| 16 | 64 | 640 | 20,884.5 | 48.99 | 49.46 | 49.50 | 49.63 |
| 32 | 64 | 640 | 22,289.2 | 91.80 | 92.25 | 92.56 | 92.67 |
To achieve these same results, follow the steps in the Quick Start Guide to download the dataset and setup the container, and then proceed to the Inference performance benchmark section for instruction on how to launch the benchmark.
Large model
Our results were obtained by running the
pytorch/scripts/inference_benchmark.sh inferencing benchmarking script in the
pytorch-20.06-py3 NGC container on NVIDIA DGX-1 with 1x V100 16GB GPU.
The command to launch the inference performance benchmark is provided in the Inference performance benchmark section.
FP16, pure Python
| Batch size | Sequence length | Memory length | Throughput Avg (tok/s) | Latency Avg (ms) | Latency 90% (ms) | Latency 95% (ms) | Latency 99% (ms) |
|---|---|---|---|---|---|---|---|
| 1 | 128 | 1,600 | 5,119.6 | 25.00 | 25.47 | 25.66 | 26.12 |
| 2 | 128 | 1,600 | 8,676.1 | 29.49 | 29.81 | 29.94 | 30.88 |
| 4 | 128 | 1,600 | 12,960.9 | 39.47 | 39.84 | 39.91 | 40.69 |
| 8 | 128 | 1,600 | 14,870.6 | 68.81 | 69.28 | 69.42 | 69.76 |
| 16 | 128 | 1,600 | 15,528.5 | 131.78 | 132.74 | 132.86 | 133.07 |
| 32 | 128 | 1,600 | 15,649.4 | 261.54 | 262.45 | 262.99 | 271.10 |
FP16, TorchScript
| Batch size | Sequence length | Memory length | Throughput Avg (tok/s) | Latency Avg (ms) | Latency 90% (ms) | Latency 95% (ms) | Latency 99% (ms) |
|---|---|---|---|---|---|---|---|
| 1 | 128 | 1,600 | 8,718.2 | 14.68 | 15.01 | 15.07 | 15.50 |
| 2 | 128 | 1,600 | 12,157.8 | 21.04 | 21.29 | 21.31 | 21.38 |
| 4 | 128 | 1,600 | 14,534.8 | 35.20 | 35.48 | 35.53 | 35.93 |
| 8 | 128 | 1,600 | 15,863.8 | 64.50 | 64.90 | 65.15 | 65.31 |
| 16 | 128 | 1,600 | 16,674.0 | 122.73 | 123.34 | 123.66 | 123.92 |
| 32 | 128 | 1,600 | 17,154.1 | 238.60 | 239.48 | 239.73 | 247.48 |
FP32, pure Python
| Batch size | Sequence length | Memory length | Throughput Avg (tok/s) | Latency Avg (ms) | Latency 90% (ms) | Latency 95% (ms) | Latency 99% (ms) |
|---|---|---|---|---|---|---|---|
| 1 | 128 | 1,600 | 3,009.8 | 42.52 | 43.01 | 43.09 | 43.53 |
| 2 | 128 | 1,600 | 3,838.4 | 66.64 | 67.24 | 67.45 | 67.83 |
| 4 | 128 | 1,600 | 4,265.3 | 119.94 | 120.87 | 121.00 | 121.39 |
| 8 | 128 | 1,600 | 4,646.5 | 220.19 | 221.30 | 221.50 | 221.68 |
| 16 | 128 | 1,600 | 4,805.4 | 426.39 | 426.25 | 426.47 | 427.25 |
| 32 | 128 | 1,600 | 4,787.4 | 855.09 | 854.95 | 855.46 | 912.05 |
FP32, TorchScript
| Batch size | Sequence length | Memory length | Throughput Avg (tok/s) | Latency Avg (ms) | Latency 90% (ms) | Latency 95% (ms) | Latency 99% (ms) |
|---|---|---|---|---|---|---|---|
| 1 | 128 | 1,600 | 3,319.0 | 38.56 | 38.91 | 39.01 | 39.19 |
| 2 | 128 | 1,600 | 3,925.2 | 65.16 | 65.74 | 65.89 | 66.12 |
| 4 | 128 | 1,600 | 4,344.1 | 117.76 | 118.46 | 118.55 | 118.69 |
| 8 | 128 | 1,600 | 4,716.2 | 216.94 | 217.99 | 218.27 | 218.69 |
| 16 | 128 | 1,600 | 4,922.1 | 415.72 | 417.16 | 417.32 | 417.59 |
| 32 | 128 | 1,600 | 4,965.2 | 824.98 | 821.79 | 831.71 | 952.47 |
To achieve these same results, follow the steps in the Quick Start Guide to download the dataset and setup the container, and then proceed to the Inference performance benchmark section for instruction on how to launch the benchmark.
Inference performance: NVIDIA T4
Base model
Our results were obtained by running the
pytorch/scripts/inference_benchmark.sh inferencing benchmarking script in the
pytorch-20.06-py3 NGC container on NVIDIA T4.
The command to launch the inference performance benchmark is provided in the Inference performance benchmark section.
FP16, pure Python
| Batch size | Sequence length | Memory length | Throughput Avg (tok/s) | Latency Avg (ms) | Latency 90% (ms) | Latency 95% (ms) | Latency 99% (ms) |
|---|---|---|---|---|---|---|---|
| 1 | 64 | 640 | 3,775.3 | 16.97 | 17.51 | 17.84 | 18.18 |
| 2 | 64 | 640 | 6,417.4 | 19.96 | 20.49 | 20.56 | 21.52 |
| 4 | 64 | 640 | 9,988.6 | 25.64 | 26.07 | 26.14 | 27.32 |
| 8 | 64 | 640 | 11,878.9 | 43.07 | 43.42 | 43.46 | 44.24 |
| 16 | 64 | 640 | 13,630.0 | 75.07 | 75.26 | 75.32 | 76.07 |
| 32 | 64 | 640 | 14,511.2 | 141.01 | 141.38 | 141.41 | 142.16 |
FP16, TorchScript
| Batch size | Sequence length | Memory length | Throughput Avg (tok/s) | Latency Avg (ms) | Latency 90% (ms) | Latency 95% (ms) | Latency 99% (ms) |
|---|---|---|---|---|---|---|---|
| 1 | 64 | 640 | 6,132.5 | 10.47 | 10.93 | 11.31 | 11.45 |
| 2 | 64 | 640 | 8,319.4 | 15.39 | 15.89 | 15.92 | 16.10 |
| 4 | 64 | 640 | 11,259.1 | 22.74 | 23.16 | 23.23 | 23.30 |
| 8 | 64 | 640 | 13,120.3 | 38.99 | 39.35 | 39.37 | 39.42 |
| 16 | 64 | 640 | 15,120.0 | 67.67 | 67.90 | 67.94 | 68.06 |
| 32 | 64 | 640 | 16,158.1 | 126.65 | 126.97 | 127.03 | 127.18 |
FP32, pure Python
| Batch size | Sequence length | Memory length | Throughput Avg (tok/s) | Latency Avg (ms) | Latency 90% (ms) | Latency 95% (ms) | Latency 99% (ms) |
|---|---|---|---|---|---|---|---|
| 1 | 64 | 640 | 2,323.1 | 27.59 | 29.39 | 29.56 | 29.86 |
| 2 | 64 | 640 | 3,094.8 | 41.39 | 42.49 | 42.78 | 43.47 |
| 4 | 64 | 640 | 3,889.8 | 65.82 | 66.60 | 66.71 | 67.57 |
| 8 | 64 | 640 | 4,270.1 | 119.80 | 120.61 | 120.68 | 120.89 |
| 16 | 64 | 640 | 4,765.7 | 214.68 | 215.87 | 216.01 | 216.14 |
| 32 | 64 | 640 | 4,985.2 | 410.43 | 413.58 | 413.67 | 413.92 |
FP32, TorchScript
| Batch size | Sequence length | Memory length | Throughput Avg (tok/s) | Latency Avg (ms) | Latency 90% (ms) | Latency 95% (ms) | Latency 99% (ms) |
|---|---|---|---|---|---|---|---|
| 1 | 64 | 640 | 2,486.3 | 25.78 | 27.52 | 27.66 | 27.92 |
| 2 | 64 | 640 | 3,260.7 | 39.28 | 40.32 | 40.49 | 40.84 |
| 4 | 64 | 640 | 4,033.3 | 63.48 | 64.28 | 64.35 | 64.56 |
| 8 | 64 | 640 | 4,411.4 | 115.96 | 116.74 | 116.85 | 116.89 |
| 16 | 64 | 640 | 4,924.9 | 207.74 | 208.91 | 209.04 | 209.21 |
| 32 | 64 | 640 | 5,163.1 | 396.29 | 399.42 | 399.50 | 399.70 |
To achieve these same results, follow the steps in the Quick Start Guide to download the dataset and setup the container, and then proceed to the Inference performance benchmark section for instruction on how to launch the benchmark.
Large model
Our results were obtained by running the
pytorch/scripts/inference_benchmark.sh inferencing benchmarking script in the
pytorch-20.06-py3 NGC container on NVIDIA T4.
The command to launch the inference performance benchmark is provided in the Inference performance benchmark section.
FP16, pure Python
| Batch size | Sequence length | Memory length | Throughput Avg (tok/s) | Latency Avg (ms) | Latency 90% (ms) | Latency 95% (ms) | Latency 99% (ms) |
|---|---|---|---|---|---|---|---|
| 1 | 128 | 1,600 | 2,978.0 | 42.99 | 43.40 | 43.44 | 44.40 |
| 2 | 128 | 1,600 | 3,161.4 | 80.98 | 81.38 | 81.45 | 81.75 |
| 4 | 128 | 1,600 | 3,459.3 | 147.89 | 148.11 | 148.14 | 148.49 |
| 8 | 128 | 1,600 | 3,657.8 | 279.74 | 279.82 | 279.86 | 280.48 |
| 16 | 128 | 1,600 | 3,762.9 | 543.92 | 543.48 | 543.55 | 544.43 |
| 32 | 128 | 1,600 | 3,794.4 | 1079.15 | 1076.23 | 1076.37 | 1158.93 |
FP16, TorchScript
| Batch size | Sequence length | Memory length | Throughput Avg (tok/s) | Latency Avg (ms) | Latency 90% (ms) | Latency 95% (ms) | Latency 99% (ms) |
|---|---|---|---|---|---|---|---|
| 1 | 128 | 1,600 | 3,066.4 | 41.74 | 42.08 | 42.12 | 42.19 |
| 2 | 128 | 1,600 | 3,399.2 | 75.31 | 75.54 | 75.57 | 75.64 |
| 4 | 128 | 1,600 | 3,721.5 | 137.47 | 137.65 | 137.70 | 137.82 |
| 8 | 128 | 1,600 | 3,932.9 | 260.19 | 260.23 | 260.29 | 260.50 |
| 16 | 128 | 1,600 | 4,057.9 | 504.43 | 503.97 | 504.01 | 504.14 |
| 32 | 128 | 1,600 | 4,117.8 | 994.54 | 991.40 | 991.46 | 1079.17 |
FP32, pure Python
| Batch size | Sequence length | Memory length | Throughput Avg (tok/s) | Latency Avg (ms) | Latency 90% (ms) | Latency 95% (ms) | Latency 99% (ms) |
|---|---|---|---|---|---|---|---|
| 1 | 128 | 1,600 | 786.9 | 162.7 | 163.2 | 163.3 | 163.9 |
| 2 | 128 | 1,600 | 889.6 | 287.8 | 288.1 | 288.2 | 288.4 |
| 4 | 128 | 1,600 | 992.1 | 515.6 | 516.0 | 516.0 | 516.5 |
| 8 | 128 | 1,600 | 1,047.0 | 977.2 | 977.6 | 977.6 | 977.8 |
| 16 | 128 | 1,600 | 1,069.3 | 1913.5 | 1914.7 | 1914.7 | 1915.0 |
| 32 | 128 | 1,600 | 1,069.5 | 3826.3 | 3823.7 | 3823.8 | 3915.8 |
FP32, TorchScript
| Batch size | Sequence length | Memory length | Throughput Avg (tok/s) | Latency Avg (ms) | Latency 90% (ms) | Latency 95% (ms) | Latency 99% (ms) |
|---|---|---|---|---|---|---|---|
| 1 | 128 | 1,600 | 792.5 | 161.5 | 161.9 | 162.0 | 162.2 |
| 2 | 128 | 1,600 | 904.7 | 283.0 | 283.3 | 283.3 | 283.4 |
| 4 | 128 | 1,600 | 1,009.0 | 507.0 | 507.3 | 507.4 | 507.5 |
| 8 | 128 | 1,600 | 1,065.0 | 960.7 | 961.1 | 961.1 | 961.2 |
| 16 | 128 | 1,600 | 1,088.6 | 1879.7 | 1880.9 | 1881.0 | 1881.1 |
| 32 | 128 | 1,600 | 1,102.0 | 3713.7 | 3710.0 | 3718.1 | 3819.0 |
To achieve these same results, follow the steps in the Quick Start Guide to download the dataset and setup the container, and then proceed to the Inference performance benchmark section for instruction on how to launch the benchmark.