
Search-based Interest Model (SIM) is a system for predicting user behavior given sequences of previous interactions.
The performance measurements in this document were conducted at the time of publication and may not reflect the performance achieved from NVIDIA's latest software release. For the most up-to-date performance measurements, go to NVIDIA Data Center Deep Learning Product Performance.
Benchmarking
The following section shows how to run benchmarks measuring the model performance in training and inference modes.
Training performance benchmark
To benchmark the training performance on a specific batch size, run:
mpiexec --allow-run-as-root --bind-to socket -np ${GPU} python main.py \
  --dataset_dir ${TF_RECORD_PATH} \
  --mode train \
  --model_type sim \
  --global_batch_size 131072 \
  --drop_remainder \
  --amp \
  --benchmark \
  --prebatch_train_size ${PREBATCH_TRAIN_SIZE} \
  --prebatch_test_size ${PREBATCH_TEST_SIZE}
Equivalent:
scripts/run_model.sh \
  --data_path ${TF_RECORD_PATH} \
  --gpus ${GPU} \
  --amp 1 \
  --benchmark 1 \
  --prebatch_train_size ${PREBATCH_TRAIN_SIZE} \
  --prebatch_test_size ${PREBATCH_TEST_SIZE}
Inference performance benchmark
To benchmark the inference performance on a specific batch size, run:
mpiexec --allow-run-as-root --bind-to socket -np ${GPU} python main.py \
  --dataset_dir ${TF_RECORD_PATH} \
  --mode inference \
  --model_type sim \
  --global_batch_size 131072 \
  --amp \
  --benchmark \
  --prebatch_train_size ${PREBATCH_TRAIN_SIZE} \
  --prebatch_test_size ${PREBATCH_TEST_SIZE}
Equivalent:
scripts/run_model.sh \
  --data_path ${TF_RECORD_PATH} \
  --gpus ${GPU} \
  --amp 1 \
  --benchmark 1 \
  --prebatch_train_size ${PREBATCH_TRAIN_SIZE} \
  --prebatch_test_size ${PREBATCH_TEST_SIZE}
Results
The following sections provide details on how we achieved our performance and accuracy in training and inference.
Training accuracy results
Our results were obtained by running the run_model.sh bash script in the TensorFlow2 21.10-py3 NGC container. Experiments were run on 1 and 8 GPUs, with FP32/TF32 Precision and AMP and with XLA-OFF/XLA-ON. Dataset was prebatched with the size of 16384. Other parameters were set to defaults.
There were 10 runs for each configuration. In the Training accuracy sections, average values are reported. In the Training stability sections, values from all runs are included in plots.
Training accuracy: NVIDIA DGX A100 (8x A100 80GB)
| GPUs | XLA | Time to train - TF32 (seconds) | Time to train - mixed precision (seconds) | AUC - TF32 | AUC - mixed precision | Time to train speedup (TF32 to mixed precision) |
|---|---|---|---|---|---|---|
| 1 | XLA-OFF | 133.62 | 109.29 | 0.82 | 0.811 | 1.22 |
| 1 | XLA-ON | 132.31 | 113.91 | 0.811 | 0.822 | 1.16 |
| 8 | XLA-OFF | 35.17 | 34.08 | 0.813 | 0.808 | 1.03 |
| 8 | XLA-ON | 39.19 | 40.16 | 0.814 | 0.811 | 0.98 |
Training accuracy: NVIDIA DGX-1 (8x V100 32GB)
| GPUs | XLA | Time to train - FP32 (seconds) | Time to train - mixed precision (seconds) | AUC - FP32 | AUC - mixed precision | Time to train speedup (FP32 to mixed precision) |
|---|---|---|---|---|---|---|
| 1 | XLA-OFF | 210.70 | 154.54 | 0.815 | 0.817 | 1.36 |
| 1 | XLA-ON | 203.61 | 159.80 | 0.816 | 0.813 | 1.27 |
| 8 | XLA-OFF | 48.643 | 44.02 | 0.811 | 0.817 | 1.11 |
| 8 | XLA-ON | 55.26 | 54.33 | 0.814 | 0.817 | 1.02 |
Training stability test
Training stability was tested over 10 runs for each configuration of double precision / AMP, XLA-ON / XLA-OFF on 1 GPU and 8 GPUs for both Volta and Ampere architectures. Each run used the same random seed and default values of training hyperparameters. Training was performed on DGX A100 80GB and DGX-1 V100 32GB setups. AUC metric achieved on test set after training is presented in the following plots.
(Plot represents XLA-OFF results, for XLA-ON results, check expandable part below)
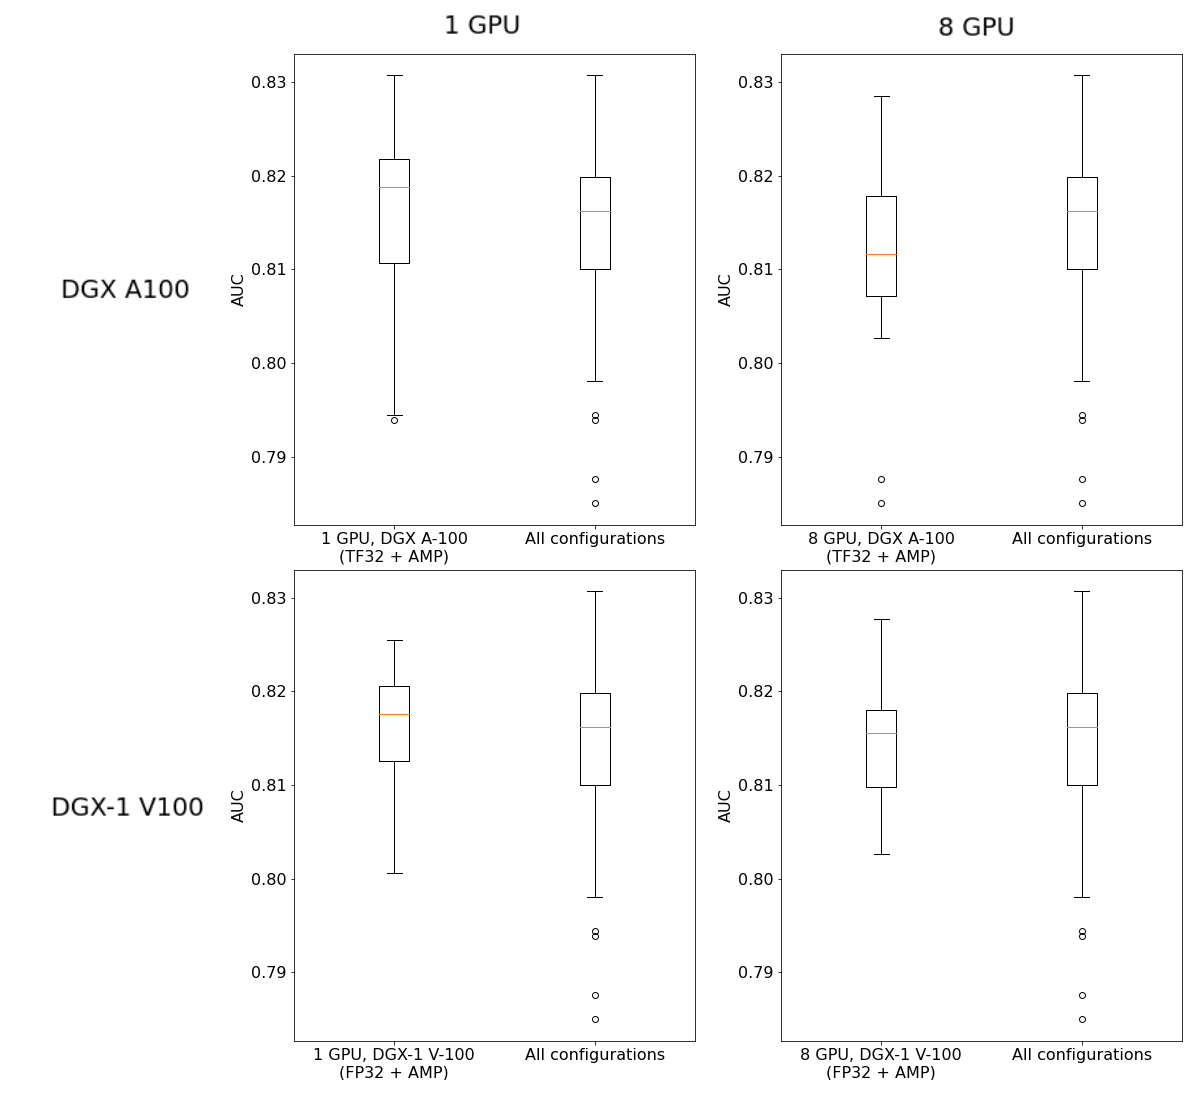
Figure 4. Training stability plot, distribution of AUC across different configurations with XLA-OFF.
Training stability with XLA-ON
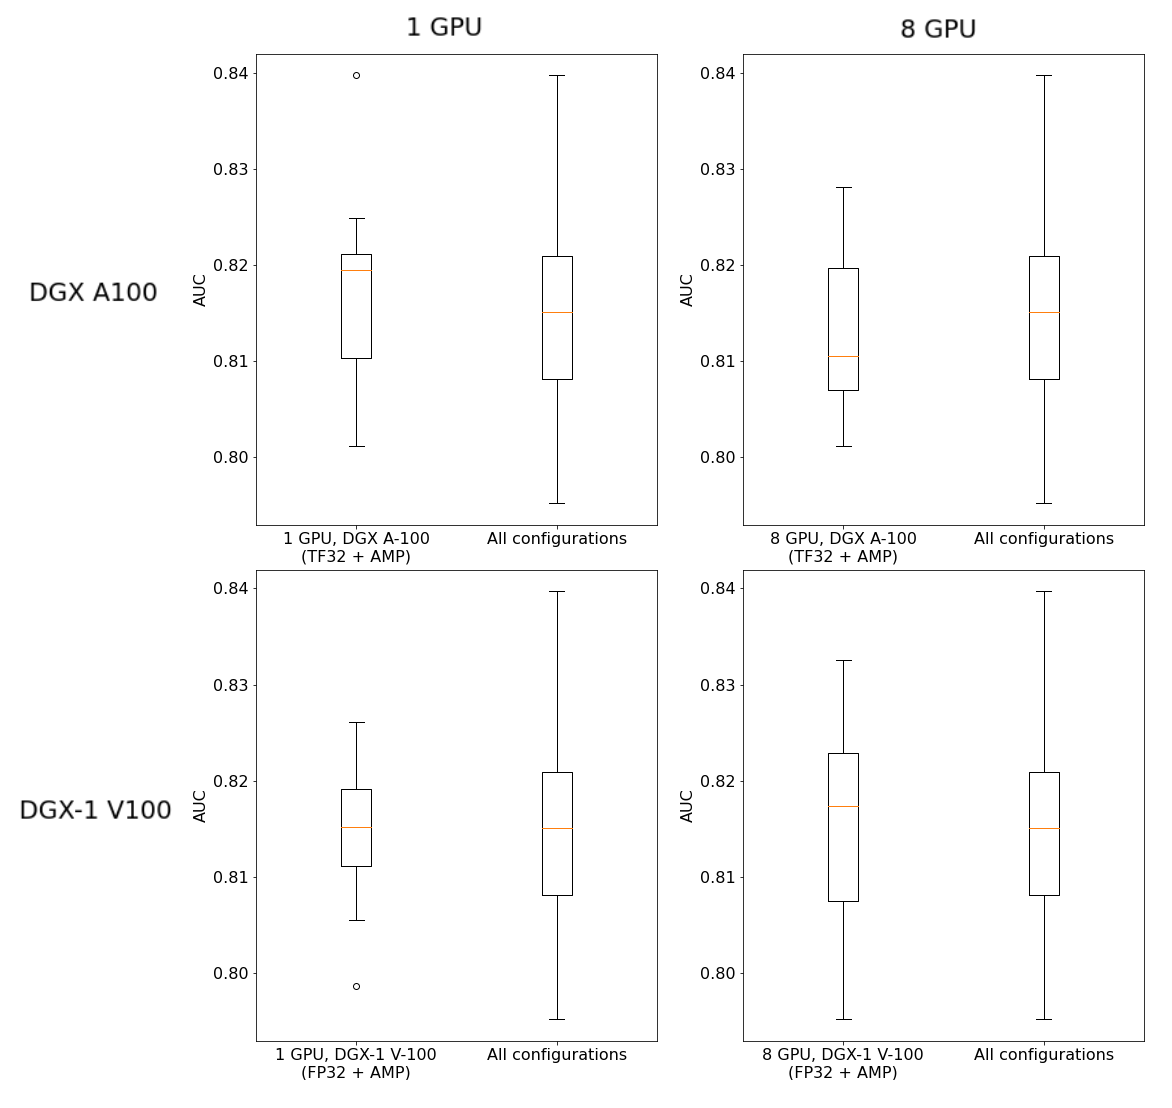
Figure 5. Training stability plot, distribution of AUC across different configurations with XLA-ON.
Complete list of training stability results
| GPUs | Precision | XLA | Mean AUC | Std AUC | Min AUC | Max AUC | |
|---|---|---|---|---|---|---|---|
| DGX A100 | 1 | TF32 | XLA-OFF | 0.8195 | 0.0083 | 0.7981 | 0.8307 |
| DGX A100 | 1 | TF32 | XLA-ON | 0.8106 | 0.0066 | 0.8012 | 0.8211 |
| DGX A100 | 1 | AMP | XLA-OFF | 0.8110 | 0.0103 | 0.7939 | 0.8244 |
| DGX A100 | 1 | AMP | XLA-ON | 0.8224 | 0.0067 | 0.8115 | 0.8397 |
| DGX A100 | 8 | TF32 | XLA-OFF | 0.8127 | 0.0070 | 0.8027 | 0.8285 |
| DGX A100 | 8 | TF32 | XLA-ON | 0.8143 | 0.0079 | 0.8012 | 0.8251 |
| DGX A100 | 8 | AMP | XLA-OFF | 0.8084 | 0.0121 | 0.7850 | 0.8203 |
| DGX A100 | 8 | AMP | XLA-ON | 0.8109 | 0.0077 | 0.8018 | 0.8281 |
| DGX-1 V100 | 1 | FP32 | XLA-OFF | 0.8152 | 0.0075 | 0.8006 | 0.8255 |
| DGX-1 V100 | 1 | FP32 | XLA-ON | 0.8158 | 0.0055 | 0.8060 | 0.8261 |
| DGX-1 V100 | 1 | AMP | XLA-OFF | 0.8172 | 0.0045 | 0.8097 | 0.8237 |
| DGX-1 V100 | 1 | AMP | XLA-ON | 0.8133 | 0.0070 | 0.7987 | 0.8234 |
| DGX-1 V100 | 8 | FP32 | XLA-OFF | 0.8112 | 0.0055 | 0.8027 | 0.8182 |
| DGX-1 V100 | 8 | FP32 | XLA-ON | 0.8144 | 0.0087 | 0.8037 | 0.8281 |
| DGX-1 V100 | 8 | AMP | XLA-OFF | 0.8173 | 0.0061 | 0.8080 | 0.8277 |
| DGX-1 V100 | 8 | AMP | XLA-ON | 0.8169 | 0.0109 | 0.7952 | 0.8326 |
For both NVIDIA Ampere and NVIDIA Volta, even though the same seed was used for each run, there is a still noticeable variance. The reason for that are built-in non-deterministic GPU kernels in tf.math.unsorted_segment_sum operation. However, since it is six times faster than the deterministic implementation of this operation, this is the preferable solution.
Impact of mixed precision on training accuracy
Results in this section present the impact of enabling AMP on the AUC. Models were trained using default parameters, on 1/8 GPUs and on Volta/Ampere architecture.
AUC is measured on test set after model training.
(Plot represents XLA-OFF results, for XLA-ON results, check expandable part below)
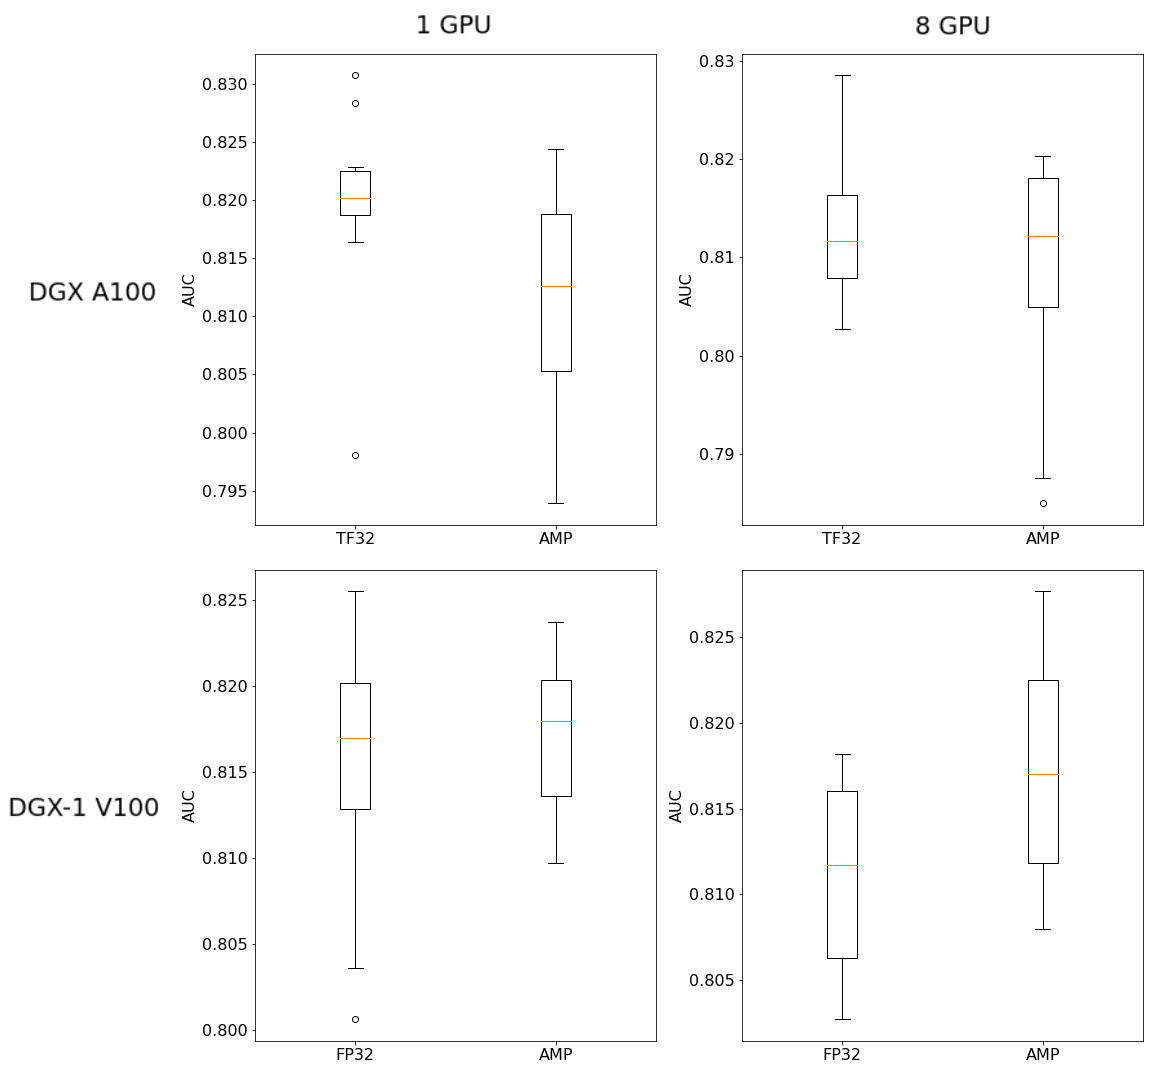
Figure 6. Impact of AMP on test set AUC (XLA-OFF)
Impact of AMP on AUC for XLA-ON
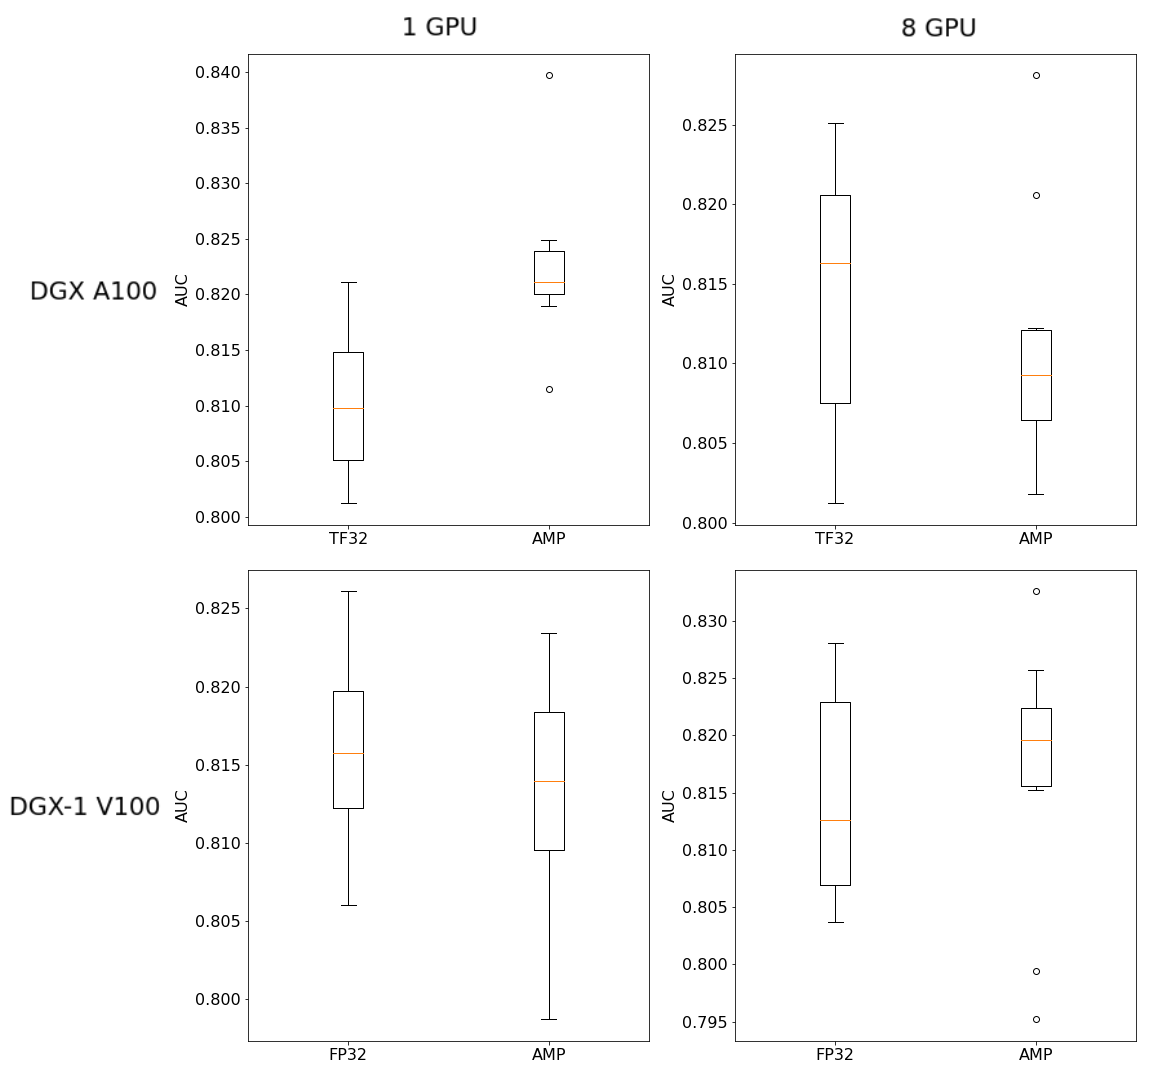
Figure 7. Impact of AMP on test set AUC (XLA-ON)
Distribution scores for full precision training and AMP training were compared in terms of mean, variance and Kolmogorov–Smirnov test to state statistical difference between full precision and AMP results. Refer to the expandable table below.
Full tabular data for AMP influence on AUC
| GPUs | XLA | Mean AUC for Full precision (TF32 for A100, FP32 for V100) | Std AUC for Full precision (TF32 for A100, FP32 for V100) | Mean AUC for AMP | Std AUC for AMP | KS test value: statistics, p-value | |
|---|---|---|---|---|---|---|---|
| DGX A100 | 1 | XLA-OFF | 0.8195 | 0.0083 | 0.8110 | 0.0103 | 0.6000, 0.0524 |
| DGX A100 | 1 | XLA-ON | 0.8106 | 0.0066 | 0.8224 | 0.0067 | 0.7000, 0.0123 |
| DGX A100 | 8 | XLA-OFF | 0.8127 | 0.0070 | 0.8084 | 0.0121 | 0.2000, 0.9945 |
| DGX A100 | 8 | XLA-ON | 0.8143 | 0.0079 | 0.8109 | 0.0077 | 0.4000, 0.4175 |
| DGX-1 V100 | 1 | XLA-OFF | 0.8152 | 0.0075 | 0.8172 | 0.0045 | 0.2000, 0.9945 |
| DGX-1 V100 | 1 | XLA-ON | 0.8158 | 0.0055 | 0.8133 | 0.0070 | 0.2000, 0.9945 |
| DGX-1 V100 | 8 | XLA-OFF | 0.8112 | 0.0055 | 0.8173 | 0.0061 | 0.4000, 0.4175 |
| DGX-1 V100 | 8 | XLA-ON | 0.8144 | 0.0087 | 0.8169 | 0.0109 | 0.4000, 0.4175 |
Training accuracy plot
Models trained with FP32, TF32, and Automatic Mixed Precision (AMP) achieve similar accuracy.
Plot represents ROC AUC on the test set for 1 and 8 GPUs, with precision FP32/TF32 (for Volta/Ampere) and AMP. All other training parameters are default.
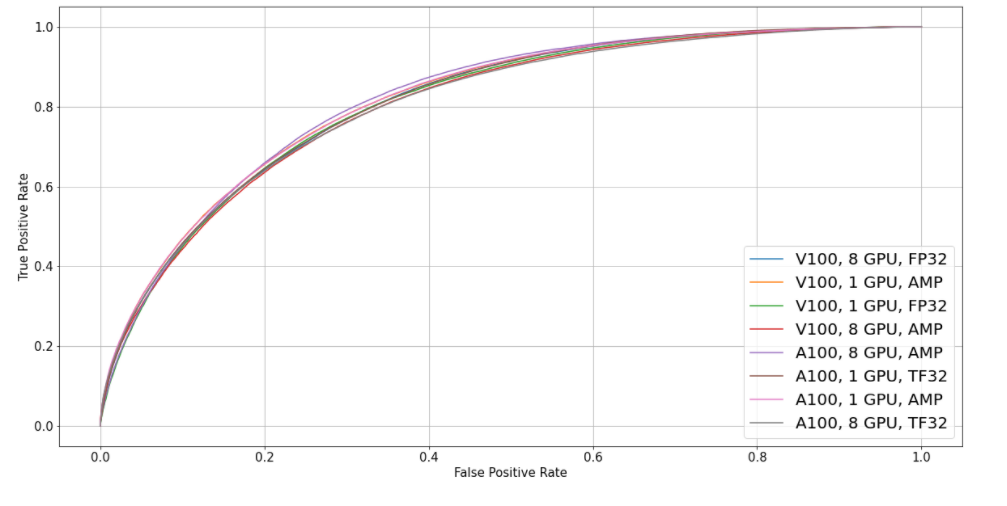
Figure 8. ROC curve for different configurations of Ampere/Volta, 1/8 GPUs, double precision / AMP. (XLA-OFF)
Training performance results
Our results were obtained by running the scripts/run_model.sh script in the TensorFlow2 21.10-py3 NGC container. Dataset was prebatched with the size of 16384.
Numbers were averaged over 10 separate runs for each configuration.
For each run, performance numbers (in samples per second) were averaged over training steps from one epoch which gives reliable estimates of the throughput. We also exclude the first 20 steps of training as a warmup phase.
The cumulative batch size of all GPUs in performance tests was set to 131072.
To achieve these same results, follow the steps in the Quick Start Guide.
Training performance: NVIDIA DGX A100 (8x A100 80GB)
| GPUs | XLA | Throughput - TF32 (samples/s) | Throughput - mixed precision (samples/s) | Throughput speedup (mixed precision / TF32) | Strong scaling - TF32 | Strong scaling - mixed precision |
|---|---|---|---|---|---|---|
| 1 | OFF | 377254.65 | 479921.54 | 1.27 | 1.00 | 1.00 |
| 1 | ON | 455724.01 | 565221.04 | 1.24 | 1.00 | 1.00 |
| 8 | OFF | 2161681.55 | 2603489.60 | 1.20 | 5.73 | 5.42 |
| 8 | ON | 2662368.18 | 2979441.80 | 1.12 | 5.84 | 5.27 |
NVIDIA DGX A100 XLA-ON / XLA-OFF training speedup
For each configuration of parameters present in the table, the Speedup column shows the speedup achieved by turning on XLA.
| GPUs | Precision | Speedup |
|---|---|---|
| 1 | TF32 | 1.208 |
| 1 | AMP | 1.178 |
| 8 | TF32 | 1.232 |
| 8 | AMP | 1.119 |
Training performance: NVIDIA DGX-2 (16x V100 32GB)
| GPUs | XLA | Throughput - FP32 (samples/s) | Throughput - mixed precision (samples/s) | Throughput speedup (mixed precision / FP32) | Strong scaling - FP32 | Strong scaling - mixed precision |
|---|---|---|---|---|---|---|
| 1 | OFF | 209376.38 | 309752.48 | 1.48 | 1.00 | 1.00 |
| 1 | ON | 245414.62 | 348945.59 | 1.42 | 1.00 | 1.00 |
| 8 | OFF | 1310239.01 | 1689602.79 | 1.29 | 6.26 | 5.45 |
| 8 | ON | 1483120.32 | 1962226.32 | 1.32 | 6.04 | 5.62 |
| 16 | OFF | 2127221.65 | 2555926.79 | 1.20 | 10.16 | 8.25 |
| 16 | ON | 2450499.40 | 2788997.07 | 1.14 | 9.99 | 7.99 |
NVIDIA DGX-2 XLA-ON / XLA-OFF training speedup
For each configuration of parameters present in the table, the Speedup column shows the speedup achieved by turning on XLA.
| GPUs | AMP | Speedup |
|---|---|---|
| 1 | FP32 | 1.172 |
| 1 | AMP | 1.127 |
| 8 | FP32 | 1.132 |
| 8 | AMP | 1.161 |
| 16 | FP32 | 1.152 |
| 16 | AMP | 1.091 |
NVIDIA DGX A100 / DGX-2 (Ampere / Volta) training speedup
| GPUs | XLA | Precision | Speedup |
|---|---|---|---|
| 1 | OFF | TF32/FP32 | 1.802 |
| 1 | OFF | AMP | 1.549 |
| 1 | ON | TF32/FP32 | 1.857 |
| 1 | ON | AMP | 1.620 |
| 8 | OFF | TF32/FP32 | 1.650 |
| 8 | OFF | AMP | 1.541 |
| 8 | ON | TF32/FP32 | 1.795 |
| 8 | ON | AMP | 1.518 |
Inference performance results
Our results were obtained by running the scripts/run_model.sh script in the TensorFlow2 21.10-py3 NGC container.
Numbers were averaged over 10 separate runs for each configuration.
For each run, performance numbers (in samples per second) were averaged over training steps from one epoch which gives reliable estimates of the throughput. We also exclude the first 20 steps of training as a warmup phase.
To achieve these same results, follow the steps in the Quick Start Guide.
Inference performance: NVIDIA DGX A100 (8x A100 80GB)
| Batch Size | XLA | Throughput - TF32 (samples/s) | Throughput - mixed precision (samples/s) | Throughput speedup (mixed precision / TF32) |
|---|---|---|---|---|
| 4096 | ON | 618547.45 | 669640.65 | 1.08 |
| 8192 | ON | 722801.14 | 849101.88 | 1.17 |
| 16384 | ON | 859418.77 | 1051361.67 | 1.22 |
| 32768 | ON | 976771.70 | 1269000.97 | 1.30 |
| 65536 | ON | 1082688.51 | 1444729.52 | 1.33 |
| 131072 | ON | 1094733.64 | 1483542.86 | 1.36 |
Complete table of DGX A100 inference performance results
| Batch Size | XLA | Precision | Throughput (samples/s) |
|---|---|---|---|
| 4096 | OFF | TF32 | 708349.73 ± 14161.58 |
| 8192 | OFF | TF32 | 873335.82 ± 8539.56 |
| 16384 | OFF | TF32 | 937987.79 ± 12114.34 |
| 32768 | OFF | TF32 | 943313.07 ± 8631.81 |
| 65536 | OFF | TF32 | 960794.46 ± 7388.45 |
| 131072 | OFF | TF32 | 966245.27 ± 8637.82 |
| 4096 | OFF | AMP | 645394.94 ± 14844.27 |
| 8192 | OFF | AMP | 919410.07 ± 11355.28 |
| 16384 | OFF | AMP | 1136346.66 ± 14529.91 |
| 32768 | OFF | AMP | 1216810.45 ± 21013.12 |
| 65536 | OFF | AMP | 1287305.05 ± 19373.18 |
| 131072 | OFF | AMP | 1298478.97 ± 10733.67 |
| 4096 | ON | TF32 | 618547.45 ± 6569.97 |
| 8192 | ON | TF32 | 722801.14 ± 9448.19 |
| 16384 | ON | TF32 | 859418.77 ± 10012.61 |
| 32768 | ON | TF32 | 976771.70 ± 13377.36 |
| 65536 | ON | TF32 | 1082688.51 ± 8523.55 |
| 131072 | ON | TF32 | 1094733.64 ± 11157.18 |
| 4096 | ON | AMP | 669640.65 ± 9319.68 |
| 8192 | ON | AMP | 849101.88 ± 14068.04 |
| 16384 | ON | AMP | 1051361.67 ± 15310.42 |
| 32768 | ON | AMP | 1269000.97 ± 23971.56 |
| 65536 | ON | AMP | 1444729.52 ± 18011.54 |
| 131072 | ON | AMP | 1483542.86 ± 6751.29 |
DGX A100 XLA-ON / XLA-OFF inference Speedup
For each configuration of parameters present in the table, the Speedup column shows the speedup achieved by turning on XLA.
| Batch Size | Precision | Speedup |
|---|---|---|
| 4096 | TF32 | 0.873 |
| 8192 | TF32 | 0.828 |
| 16384 | TF32 | 0.916 |
| 32768 | TF32 | 1.035 |
| 65536 | TF32 | 1.127 |
| 131072 | TF32 | 1.133 |
| 4096 | AMP | 1.038 |
| 8192 | AMP | 0.924 |
| 16384 | AMP | 0.925 |
| 32768 | AMP | 1.043 |
| 65536 | AMP | 1.187 |
| 131072 | AMP | 1.143 |
Inference performance: NVIDIA DGX-2 (16x V100 32GB)
| Batch Size | XLA | Throughput - FP32 (samples/s) | Throughput - mixed precision (samples/s) | Throughput speedup (mixed precision / FP32) |
|---|---|---|---|---|
| 4096 | ON | 444532.22 | 541975.24 | 1.22 |
| 8192 | ON | 505047.64 | 642784.48 | 1.27 |
| 16384 | ON | 549325.54 | 727077.63 | 1.32 |
| 32768 | ON | 587452.73 | 788606.35 | 1.34 |
| 65536 | ON | 605187.67 | 832651.59 | 1.38 |
| 131072 | ON | 599557.03 | 840602.90 | 1.40 |
Complete table of DGX-2 inference performance results
| Batch Size | XLA | Precision | Throughput (samples/s) |
|---|---|---|---|
| 4096 | OFF | FP32 | 459175.30 ± 23184.33 |
| 8192 | OFF | FP32 | 499179.20 ± 15967.26 |
| 16384 | OFF | FP32 | 525180.72 ± 2521.56 |
| 32768 | OFF | FP32 | 532042.10 ± 4020.44 |
| 65536 | OFF | FP32 | 534307.20 ± 7276.26 |
| 131072 | OFF | FP32 | 532311.44 ± 6195.16 |
| 4096 | OFF | AMP | 581771.66 ± 6163.50 |
| 8192 | OFF | AMP | 665048.04 ± 4607.95 |
| 16384 | OFF | AMP | 716355.19 ± 7174.98 |
| 32768 | OFF | AMP | 741642.61 ± 4981.04 |
| 65536 | OFF | AMP | 755141.25 ± 6175.05 |
| 131072 | OFF | AMP | 744459.46 ± 8183.17 |
| 4096 | ON | FP32 | 444532.22 ± 6239.01 |
| 8192 | ON | FP32 | 505047.64 ± 6543.06 |
| 16384 | ON | FP32 | 549325.54 ± 2841.21 |
| 32768 | ON | FP32 | 587452.73 ± 2366.43 |
| 65536 | ON | FP32 | 605187.67 ± 3740.07 |
| 131072 | ON | FP32 | 599557.03 ± 11811.28 |
| 4096 | ON | AMP | 541975.24 ± 4441.93 |
| 8192 | ON | AMP | 642784.48 ± 4721.08 |
| 16384 | ON | AMP | 727077.63 ± 5332.80 |
| 32768 | ON | AMP | 788606.35 ± 11705.36 |
| 65536 | ON | AMP | 832651.59 ± 10401.17 |
| 131072 | ON | AMP | 840602.90 ± 16358.73 |
DGX-2 XLA-ON / XLA-OFF inference speedup
For each configuration of parameters present in the table, the Speedup column shows the speedup achieved by turning on XLA.
| Batch Size | Precision | Speedup |
|---|---|---|
| 4096 | TF32 | 0.968 |
| 8192 | TF32 | 1.012 |
| 16384 | TF32 | 1.046 |
| 32768 | TF32 | 1.104 |
| 65536 | TF32 | 1.133 |
| 131072 | TF32 | 1.126 |
| 4096 | AMP | 0.932 |
| 8192 | AMP | 0.967 |
| 16384 | AMP | 1.384 |
| 32768 | AMP | 1.063 |
| 65536 | AMP | 1.103 |
| 131072 | AMP | 1.129 |
NVIDIA A100 / DGX-2 (Ampere / Volta) inference speedup
| Batch Size | XLA | Precision | Speedup |
|---|---|---|---|
| 4096 | OFF | TF32/FP32 | 1.54 |
| 8192 | OFF | TF32/FP32 | 1.75 |
| 16384 | OFF | TF32/FP32 | 1.79 |
| 32768 | OFF | TF32/FP32 | 1.77 |
| 65536 | OFF | TF32/FP32 | 1.80 |
| 131072 | OFF | TF32/FP32 | 1.81 |
| 4096 | OFF | AMP | 1.11 |
| 8192 | OFF | AMP | 1.38 |
| 16384 | OFF | AMP | 1.59 |
| 32768 | OFF | AMP | 1.64 |
| 65536 | OFF | AMP | 1.71 |
| 131072 | OFF | AMP | 1.74 |
| 4096 | ON | TF32/FP32 | 1.39 |
| 8192 | ON | TF32/FP32 | 1.43 |
| 16384 | ON | TF32/FP32 | 1.56 |
| 32768 | ON | TF32/FP32 | 1.66 |
| 65536 | ON | TF32/FP32 | 1.79 |
| 131072 | ON | TF32/FP32 | 1.83 |
| 4096 | ON | AMP | 1.24 |
| 8192 | ON | AMP | 1.32 |
| 16384 | ON | AMP | 1.45 |
| 32768 | ON | AMP | 1.61 |
| 65536 | ON | AMP | 1.74 |
| 131072 | ON | AMP | 1.76 |