
With modified architecture and initialization this ResNet50 version gives ~0.5% better accuracy than original.
The performance measurements in this document were conducted at the time of publication and may not reflect the performance achieved from NVIDIA's latest software release. For the most up-to-date performance measurements, go to NVIDIA Data Center Deep Learning Product Performance.
Benchmarking
To benchmark training and inference, run:
python benchmark.py -n <numbers of gpus separated by comma> -b <batch sizes per GPU separated by comma> --data-root <path to imagenet> --dtype <float32 or float16> -o <path to benchmark report>
- To control the benchmark length per epoch, use the
-iflag (defaults to 100 iterations). - To control the number of epochs, use the
-eflag. - To control the number of warmup epochs (epochs which are not taken into account), use the
-wflag. - To limit the length of the dataset, use the
--num-examplesflag.
By default, the same parameters as in ./runner will be used. Additional flags will be passed to ./runner.
Training performance benchmark
To benchmark only training, use the --mode train flag.
Inference performance benchmark
To benchmark only inference, use the --mode val flag.
Results
The following sections provide details on how we achieved our performance and accuracy in training and inference.
Training accuracy results
Training accuracy: NVIDIA DGX A100 (8x A100 80GB)
90 epochs configuration
Our results were obtained by running 8 times the ./runner -n <number of gpus> -b 512 --dtype float32 script for TF32 and the ./runner -n <number of gpus> -b 512 script for mixed precision in the mxnet-22.10-py3 NGC container on NVIDIA DGX A100 with (8x A100 80GB) GPUs.
| GPUs | Accuracy - mixed precision | Accuracy - TF32 | Time to train - mixed precision | Time to train - TF32 | Time to train - speedup |
|---|---|---|---|---|---|
| 1 | 77.185 | 77.184 | 8.75 | 29.39 | 3.36 |
| 8 | 77.185 | 77.184 | 1.14 | 3.82 | 3.35 |
Training accuracy: NVIDIA DGX-1 (8x V100 16GB)
90 epochs configuration
Our results were obtained by running the ./runner -n <number of gpus> -b 96 --dtype float32 training script for FP32 and the ./runner -n <number of gpus> -b 192 training script for mixed precision in the mxnet-22.10-py3 NGC container on NVIDIA DGX-1 with (8x V100 16GB) GPUs.
| GPUs | Accuracy - mixed precision | Accuracy - FP32 | Time to train - mixed precision | Time to train - FP32 | Time to train - speedup |
|---|---|---|---|---|---|
| 1 | 77.342 | 77.160 | 24.2 | 84.5 | 3.49 |
| 4 | 77.196 | 77.290 | 6.0 | 21.4 | 3.59 |
| 8 | 77.150 | 77.313 | 3.0 | 10.7 | 3.54 |
Training stability test
Our results were obtained by running the following commands 8 times with different seeds.
-
For 50 epochs
./runner -n 8 -b 96 --dtype float32 --num-epochs 50for FP32./runner -n 8 -b 192 --num-epochs 50for mixed precision
-
For 90 epochs
./runner -n 8 -b 96 --dtype float32for FP32./runner -n 8 -b 192for mixed precision
-
For 250 epochs
./runner -n 8 -b 96 --dtype float32 --num-epochs 250 --mixup 0.2for FP32./runner -n 8 -b 192 --num-epochs 250 --mixup 0.2for mixed precision
| # of epochs | mixed precision avg top1 | FP32 avg top1 | mixed precision standard deviation | FP32 standard deviation | mixed precision minimum top1 | FP32 minimum top1 | mixed precision maximum top1 | FP32 maximum top1 |
|---|---|---|---|---|---|---|---|---|
| 50 | 76.308 | 76.329 | 0.00073 | 0.00094 | 76.230 | 76.234 | 76.440 | 76.470 |
| 90 | 77.150 | 77.313 | 0.00098 | 0.00085 | 76.972 | 77.228 | 77.266 | 77.474 |
| 250 | 78.460 | 78.483 | 0.00078 | 0.00065 | 78.284 | 78.404 | 78.560 | 78.598 |
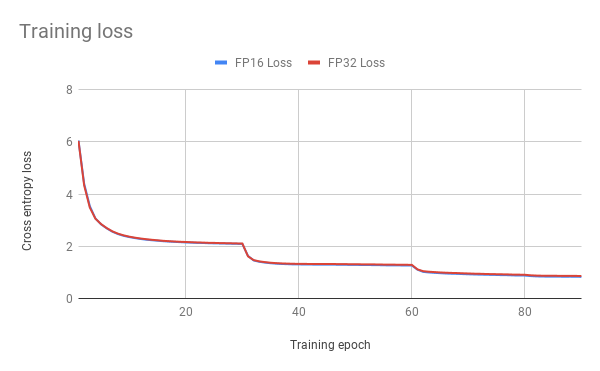
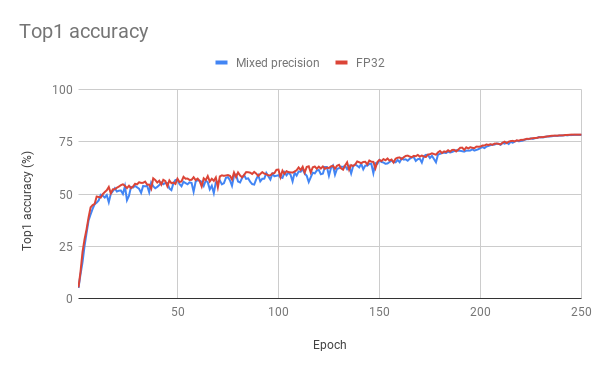
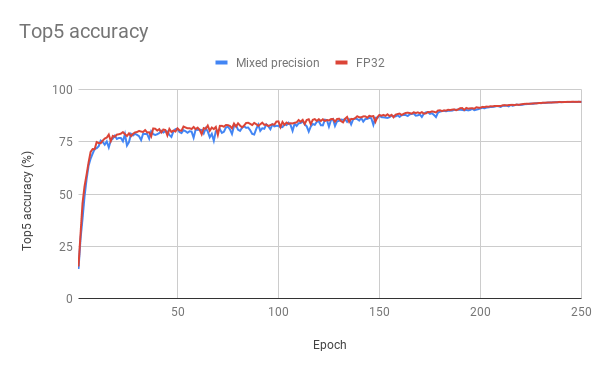
Plots for 250 epoch configuration Here are example graphs of FP32 and mixed precision training on 8 GPU 250 epochs configuration:
Training performance results
Training performance: NVIDIA DGX A100 (8x A100 80GB)
The following results were obtained by running the
python benchmark.py -n 1,4,8 -b 512 --dtype float32 -o benchmark_report_tf32.json -i 500 -e 3 -w 1 --num-examples 32000 --mode train script for TF32 and the
python benchmark.py -n 1,4,8 -b 512 --dtype float16 -o benchmark_report_fp16.json -i 500 -e 3 -w 1 --num-examples 32000 --mode train script for mixed precision in the mxnet-22.10-py3 NGC container on NVIDIA DGX A100 with (8x A100 80GB) GPUs.
Training performance reported as Total IPS (data + compute time taken into account). Weak scaling is calculated as a ratio of speed for given number of GPUs to speed for 1 GPU.
| GPUs | Throughput - mixed precision | Throughput - TF32 | Throughput speedup (TF32 - mixed precision) | Weak scaling - mixed precision | Weak scaling - TF32 |
|---|---|---|---|---|---|
| 1 | 3410.52 | 1055.78 | 2.18 | 1.00 | 1.00 |
| 4 | 13442.66 | 4182.30 | 3.24 | 3.97 | 3.96 |
| 8 | 26673.72 | 8247.44 | 3.23 | 7.82 | 7.81 |
Training performance: NVIDIA DGX-1 (8x V100 16GB)
The following results were obtained by running the
python benchmark.py -n 1,2,4,8 -b 192 --dtype float16 -o benchmark_report_fp16.json -i 500 -e 3 -w 1 --num-examples 32000 --mode train script for mixed precision and the
python benchmark.py -n 1,2,4,8 -b 96 --dtype float32 -o benchmark_report_fp32.json -i 500 -e 3 -w 1 --num-examples 32000 --mode train script for FP32 in the mxnet-20.12-py3 NGC container on NVIDIA DGX-1 with (8x V100 16GB) GPUs.
Training performance reported as Total IPS (data + compute time taken into account). Weak scaling is calculated as a ratio of speed for given number of GPUs to speed for 1 GPU.
| GPUs | Throughput - mixed precision | Throughput - FP32 | Throughput speedup (FP32 - mixed precision) | Weak scaling - mixed precision | Weak scaling - FP32 |
|---|---|---|---|---|---|
| 1 | 1376 | 384 | 3.58 | 1.00 | 1.00 |
| 2 | 2768 | 763 | 3.62 | 2.01 | 1.98 |
| 4 | 5357 | 1513 | 3.54 | 3.89 | 3.94 |
| 8 | 10723 | 3005 | 3.56 | 7.79 | 7.82 |
Training performance: NVIDIA DGX-2 (16x V100 32GB)
The following results were obtained by running the
python benchmark.py -n 1,2,4,8,16 -b 256 --dtype float16 -o benchmark_report_fp16.json -i 500 -e 3 -w 1 --num-examples 32000 --mode train script for mixed precision and the
python benchmark.py -n 1,2,4,8,16 -b 128 --dtype float32 -o benchmark_report_fp32.json -i 500 -e 3 -w 1 --num-examples 32000 --mode train script for FP32 in the mxnet-20.12-py3 NGC container on NVIDIA DGX-2 with (16x V100 32GB) GPUs.
Training performance reported as Total IPS (data + compute time taken into account). Weak scaling is calculated as a ratio of speed for given number of GPUs to speed for 1 GPU.
| GPUs | Throughput - mixed precision | Throughput - FP32 | Throughput speedup (FP32 - mixed precision) | Weak scaling - mixed precision | Weak scaling - FP32 |
|---|---|---|---|---|---|
| 1 | 1492 | 417 | 3.57 | 1.00 | 1.00 |
| 2 | 2935 | 821 | 3.57 | 1.96 | 1.96 |
| 4 | 5726 | 1623 | 3.52 | 3.83 | 3.92 |
| 8 | 11368 | 3223 | 3.52 | 7.61 | 7.72 |
| 16 | 21484 | 6338 | 3.38 | 14.39 | 15.19 |
Inference performance results
Inference performance: NVIDIA DGX A100 (1x A100 80GB)
The following results were obtained by running the
python benchmark.py -n 1 -b 1,2,4,8,16,32,64,128,192,256 --dtype float16 -o inferbenchmark_report_fp16.json -i 500 -e 3 -w 1 --mode val script for mixed precision and the
python benchmark.py -n 1 -b 1,2,4,8,16,32,64,128,192,256 --dtype float32 -o inferbenchmark_report_tf32.json -i 500 -e 3 -w 1 --mode val script for TF32 in the mxnet-22.10-py3 NGC container on NVIDIA DGX A100 with (8x A100 80GB) GPUs.
Inference performance reported as Total IPS (data + compute time taken into account). Reported mixed precision speedups are relative to TF32 numbers for corresponding configuration.
| Batch size | Throughput (img/sec) - mixed precision | Throughput - speedup | Avg latency (ms) - mixed precision | Avg latency - speedup | 50% latency (ms) - mixed precision | 50% latency - speedup | 90% latency (ms) - mixed precision | 90% latency - speedup | 95% latency (ms) - mixed precision | 95% latency - speedup | 99% latency (ms) - mixed precision | 99% latency - speedup |
|---|---|---|---|---|---|---|---|---|---|---|---|---|
| 1 | 1431.99 | 1.9 | 0.7 | 1.9 | 0.68 | 1.95 | 0.71 | 1.9 | 0.84 | 1.65 | 0.88 | 1.7 |
| 2 | 2530.66 | 2.19 | 0.79 | 2.19 | 0.74 | 2.31 | 0.86 | 2.05 | 0.93 | 2.0 | 2.0 | 0.97 |
| 4 | 3680.74 | 2.11 | 1.09 | 2.11 | 0.92 | 2.49 | 1.21 | 1.98 | 1.64 | 1.51 | 6.03 | 0.45 |
| 8 | 2593.88 | 1.11 | 3.08 | 1.11 | 2.89 | 1.17 | 4.09 | 0.89 | 4.72 | 0.8 | 9.85 | 0.55 |
| 16 | 4340.08 | 1.52 | 3.69 | 1.52 | 3.31 | 1.68 | 4.73 | 1.24 | 6.3 | 0.95 | 12.31 | 0.54 |
| 32 | 6808.22 | 2.1 | 4.7 | 2.1 | 4.0 | 2.46 | 6.44 | 1.58 | 9.01 | 1.15 | 15.88 | 0.68 |
| 64 | 7659.96 | 2.21 | 8.36 | 2.21 | 7.44 | 2.48 | 10.76 | 1.75 | 13.91 | 1.37 | 21.96 | 0.9 |
| 128 | 8017.67 | 2.23 | 15.96 | 2.23 | 15.0 | 2.37 | 18.95 | 1.9 | 21.65 | 1.67 | 30.36 | 1.23 |
| 192 | 8240.8 | 2.26 | 23.3 | 2.26 | 22.49 | 2.33 | 25.65 | 2.07 | 27.54 | 1.94 | 37.19 | 1.5 |
| 256 | 7909.62 | 2.15 | 32.37 | 2.15 | 31.66 | 2.2 | 34.27 | 2.05 | 37.02 | 1.9 | 42.83 | 1.66 |
| 512 | 7213.43 | 2.07 | 70.98 | 2.07 | 70.48 | 2.08 | 73.21 | 2.04 | 74.38 | 2.03 | 79.15 | 1.99 |
Inference performance: NVIDIA DGX-1 (1x V100 16GB)
The following results were obtained by running the
python benchmark.py -n 1 -b 1,2,4,8,16,32,64,128,192,256 --dtype float16 -o inferbenchmark_report_fp16.json -i 500 -e 3 -w 1 --mode val script for mixed precision and the
python benchmark.py -n 1 -b 1,2,4,8,16,32,64,128,192,256 --dtype float32 -o inferbenchmark_report_fp32.json -i 500 -e 3 -w 1 --mode val script for FP32 in the mxnet-20.12-py3 NGC container on NVIDIA DGX-1 with (8x V100 16GB) GPUs.
Inference performance reported as Total IPS (data + compute time taken into account). Reported mixed precision speedups are relative to FP32 numbers for corresponding configuration.
| Batch size | Throughput (img/sec) - mixed precision | Throughput - speedup | Avg latency (ms) - mixed precision | Avg latency - speedup | 50% latency (ms) - mixed precision | 50% latency - speedup | 90% latency (ms) - mixed precision | 90% latency - speedup | 95% latency (ms) - mixed precision | 95% latency - speedup | 99% latency (ms) - mixed precision | 99% latency - speedup |
|---|---|---|---|---|---|---|---|---|---|---|---|---|
| 1 | 286 | 1.27 | 3.48 | 1.27 | 3.45 | 1.27 | 3.61 | 1.26 | 3.68 | 1.26 | 3.86 | 1.24 |
| 2 | 519 | 1.34 | 3.84 | 1.34 | 3.77 | 1.35 | 4.05 | 1.31 | 4.16 | 1.29 | 4.59 | 1.27 |
| 4 | 910 | 1.60 | 4.39 | 1.60 | 4.35 | 1.61 | 4.59 | 1.56 | 4.66 | 1.56 | 5.19 | 1.47 |
| 8 | 1642 | 2.20 | 4.87 | 2.20 | 4.68 | 2.29 | 5.35 | 2.05 | 6.01 | 1.84 | 11.06 | 1.04 |
| 16 | 2359 | 2.55 | 6.78 | 2.55 | 6.49 | 2.66 | 7.07 | 2.48 | 8.33 | 2.12 | 13.89 | 1.30 |
| 32 | 2902 | 2.86 | 11.02 | 2.86 | 10.43 | 3.02 | 12.25 | 2.60 | 13.88 | 2.31 | 21.41 | 1.55 |
| 64 | 3234 | 2.74 | 19.78 | 2.74 | 18.89 | 2.86 | 22.50 | 2.44 | 25.38 | 2.17 | 30.78 | 1.81 |
| 128 | 3362 | 2.69 | 38.06 | 2.69 | 37.20 | 2.75 | 42.32 | 2.44 | 45.12 | 2.30 | 50.59 | 2.07 |
| 192 | 3178 | 2.52 | 60.40 | 2.52 | 59.62 | 2.55 | 65.56 | 2.35 | 68.16 | 2.25 | 73.72 | 2.10 |
| 256 | 3057 | 2.38 | 83.73 | 2.38 | 82.77 | 2.40 | 92.26 | 2.24 | 92.26 | 2.17 | 100.84 | 2.23 |
Inference performance: NVIDIA T4
The following results were obtained by running the
python benchmark.py -n 1 -b 1,2,4,8,16,32,64,128,192,256 --dtype float16 -o inferbenchmark_report_fp16.json -i 500 -e 3 -w 1 --mode val script for mixed precision and the
python benchmark.py -n 1 -b 1,2,4,8,16,32,64,128,192,256 --dtype float32 -o inferbenchmark_report_fp32.json -i 500 -e 3 -w 1 --mode val script for FP32 in the mxnet-20.12-py3 NGC container on an NVIDIA T4 GPU.
Inference performance reported as Total IPS (data + compute time taken into account). Reported mixed precision speedups are relative to FP32 numbers for corresponding configuration.
| Batch size | Throughput (img/sec) - mixed precision | Throughput - speedup | Avg latency (ms) - mixed precision | Avg latency - speedup | 50% latency (ms) - mixed precision | 50% latency - speedup | 90% latency (ms) - mixed precision | 90% latency - speedup | 95% latency (ms) - mixed precision | 95% latency - speedup | 99% latency (ms) - mixed precision | 99% latency - speedup |
|---|---|---|---|---|---|---|---|---|---|---|---|---|
| 1 | 131 | 1.11 | 7.61 | 1.17 | 7.10 | 0.97 | 10.28 | 0.92 | 11.35 | 0.95 | 15.05 | 0.96 |
| 2 | 277 | 1.48 | 7.20 | 1.53 | 7.30 | 1.19 | 7.74 | 1.48 | 8.82 | 1.49 | 12.09 | 1.58 |
| 4 | 374 | 1.47 | 10.67 | 1.50 | 10.20 | 1.40 | 13.51 | 1.09 | 14.82 | 1.03 | 22.36 | 0.74 |
| 8 | 672 | 2.21 | 11.90 | 2.23 | 11.21 | 2.21 | 14.54 | 1.74 | 17.24 | 1.48 | 28.65 | 0.92 |
| 16 | 1267 | 3.57 | 12.62 | 3.58 | 12.02 | 3.59 | 14.02 | 3.13 | 16.02 | 2.76 | 22.28 | 2.01 |
| 32 | 1473 | 3.85 | 21.71 | 3.86 | 21.67 | 3.76 | 22.63 | 3.64 | 22.98 | 3.60 | 23.85 | 3.52 |
| 64 | 1561 | 3.70 | 40.98 | 3.70 | 40.87 | 3.64 | 41.98 | 3.57 | 42.56 | 3.53 | 43.85 | 3.46 |
| 128 | 1555 | 3.60 | 82.26 | 3.60 | 81.86 | 3.57 | 83.87 | 3.51 | 84.63 | 3.49 | 96.56 | 3.09 |
| 192 | 1545 | 3.64 | 124.26 | 3.64 | 123.67 | 3.61 | 125.76 | 3.58 | 126.73 | 3.56 | 143.27 | 3.19 |
| 256 | 1559 | 3.71 | 164.15 | 3.71 | 163.97 | 3.71 | 166.28 | 3.70 | 167.01 | 3.70 | 168.54 | 3.69 |