
HiFi-GAN model implements a spectrogram inversion model that allows to synthesize speech waveforms from mel-spectrograms.
Benchmarking
The following section shows how to run benchmarks measuring the model performance in training and inference mode.
Training performance benchmark
To benchmark the training performance on a specific batch size, run:
-
NVIDIA DGX A100 (8x A100 80GB)
AMP=true NUM_GPUS=1 BS=64 GRAD_ACCUMULATION=8 EPOCHS=10 bash scripts/train.sh AMP=true NUM_GPUS=8 BS=64 GRAD_ACCUMULATION=1 EPOCHS=10 bash scripts/train.sh NUM_GPUS=1 BS=64 GRAD_ACCUMULATION=8 EPOCHS=10 bash scripts/train.sh NUM_GPUS=8 BS=64 GRAD_ACCUMULATION=1 EPOCHS=10 bash scripts/train.sh -
NVIDIA DGX-1 (8x V100 16GB)
AMP=true NUM_GPUS=1 BS=64 GRAD_ACCUMULATION=8 EPOCHS=10 bash scripts/train.sh
AMP=true NUM_GPUS=8 BS=64 GRAD_ACCUMULATION=1 EPOCHS=10 bash scripts/train.sh
NUM_GPUS=1 BS=64 GRAD_ACCUMULATION=8 EPOCHS=10 bash scripts/train.sh
NUM_GPUS=8 BS=64 GRAD_ACCUMULATION=1 EPOCHS=10 bash scripts/train.sh
Each of these scripts runs for 10 epochs and measures the
average number of items per second for each epoch. The performance results can be read from
the nvlog.json files produced by the commands.
Inference performance benchmark
To benchmark the inference performance on a specific batch size, run:
-
For FP16
AMP=true BATCH_SIZE=1 REPEATS=100 bash scripts/inference_benchmark.sh -
For FP32 or TF32
BATCH_SIZE=1 REPEATS=100 bash scripts/inference_benchmark.sh
The output log files will contain performance numbers for the HiFi-GAN model
(number of input mel-spectrogram frames per second, reported as hifigan_frames/s)
and FastPitch (number of output mel-spectrogram frames per second as mel_gen_frames/s).
The inference.py script will run a few warm-up iterations before running the benchmark. Inference will be averaged over 100 runs, as set by the REPEATS env variable.
Results
The following sections provide details on how we achieved our performance and accuracy in training and inference.
Training accuracy results
Training accuracy: NVIDIA DGX A100 (8x A100 80GB)
Our results were obtained by running the ./platform/DGXA100_HiFi-GAN_{AMP,TF32}_8GPU.sh training script in the 21.12-py3 NGC container on NVIDIA DGX A100 (8x A100 80GB) GPUs.
We present median mel loss values calculated on the validation subset at the end of the training.
| Dataset | Batch size / GPU | Grad accumulation | GPUs | Val mel loss - FP32 | Val mel loss - mixed precision | Time to train - FP32 | Time to train - mixed precision | Time to train speedup (FP32 to mixed precision) |
|---|---|---|---|---|---|---|---|---|
| LJSpeech-1.1 | 128 | 1 | 1 | 9.65 | 9.68 | 151.4 h | 117.1 h | 1.29x |
| LJSpeech-1.1 | 16 | 1 | 8 | 9.65 | 9.68 | 32.9 h | 32.8 h | 1.00x |
Training accuracy: NVIDIA DGX-1 (8x V100 16GB)
Our results were obtained by running the ./platform/DGX1_HiFi-GAN_{AMP,FP32}_8GPU.sh training script in the 21.12-py3 NGC container on NVIDIA DGX-1 (8x V100 16GB) GPUs.
We present median mel loss values calculated on the validation subset at the end of the training.
| Dataset | Batch size / GPU | Grad accumulation | GPUs | Val mel loss - FP32 | Val mel loss - mixed precision | Time to train - FP32 | Time to train - mixed precision | Time to train speedup (FP32 to mixed precision) |
|---|---|---|---|---|---|---|---|---|
| LJSpeech-1.1 | 32 | 4 | 1 | 9.65 | 9.73 | 604.6 h | 279.7 h | 2.16x |
| LJSpeech-1.1 | 64 | 2 | 1 | 9.65 | 9.73 | - | 240.2 h | 2.52x |
| LJSpeech-1.1 | 16 | 1 | 8 | 9.65 | 9.73 | 88.3 h | 56.7 h | 1.56x |
Fine tuning of the model on FastPitch outputs makes about half of the steps of the base model and will prolong the training by 50%.
Training stability test
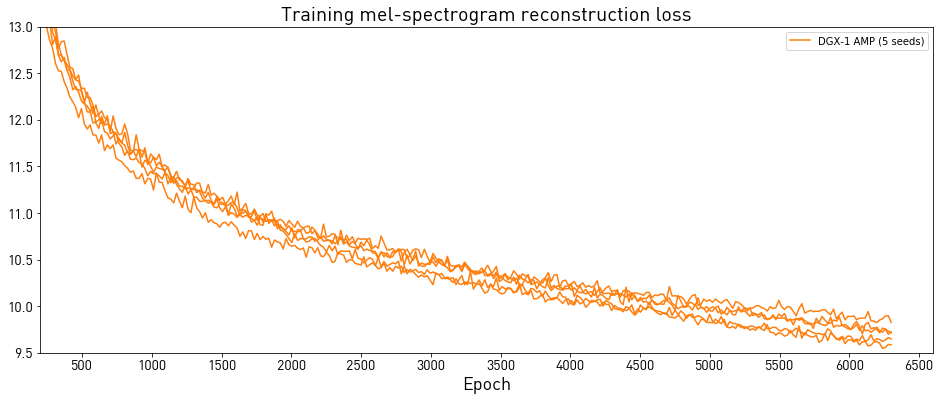
The training is stable when different random seeds are used. Below we compare loss curves obtained by training HiFi-GAN with different seeds.
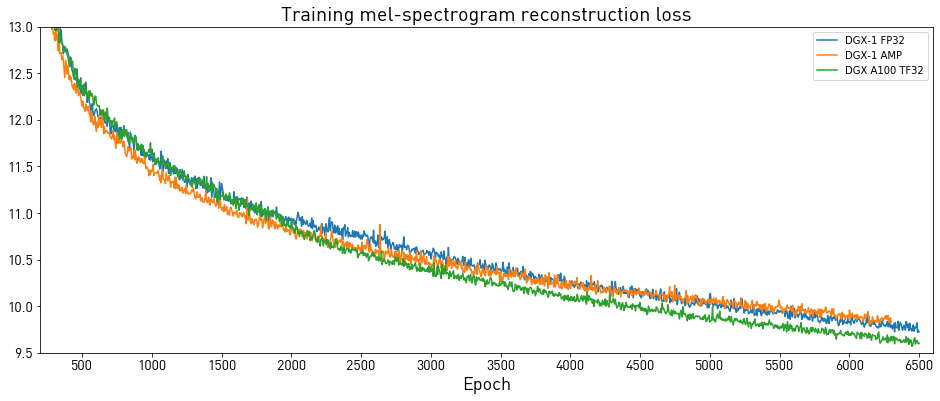
The training is also stable with respect to different platforms:
Training performance results
Training performance: NVIDIA DGX A100 (8x A100 80GB)
Our results were obtained by running the ./platform/DGXA100_HiFi-GAN_{AMP,TF32}_8GPU.sh training script in the 21.12-py3 NGC container on NVIDIA DGX A100 (8x A100 80GB) GPUs. Performance numbers, in input mel-scale spectrogram frames per second, were averaged over an entire training epoch.
| Batch size / GPU | Grad accumulation | GPUs | Throughput - TF32 | Throughput - mixed precision | Throughput speedup (TF32 to mixed precision) | Strong scaling - TF32 | Strong scaling - mixed precision |
|---|---|---|---|---|---|---|---|
| 128 | 1 | 1 | 12055.44 | 15578.65 | 1.29 | 1.00 | 1.00 |
| 32 | 1 | 4 | 36766.63 | 40949.55 | 1.11 | 3.05 | 2.63 |
| 16 | 1 | 8 | 55372.63 | 55634.66 | 1.00 | 4.59 | 3.57 |
Training performance: NVIDIA DGX-1 (8x V100 16GB)
Our results were obtained by running the ./platform/DGX1_HiFi-GAN_{AMP,FP32}_8GPU.sh
training script in the PyTorch 21.12-py3 NGC container on NVIDIA DGX-1 with
8x V100 16GB GPUs. Performance numbers, in output mel-scale spectrogram frames per second, were averaged over
an entire training epoch.
| Batch size / GPU | Grad accumulation | GPUs | Throughput - FP32 | Throughput - mixed precision | Throughput speedup (FP32 to mixed precision) | Strong scaling - FP32 | Strong scaling - mixed precision |
|---|---|---|---|---|---|---|---|
| 32 | 4 | 1 | 3017.57 | 6522.37 | 2.16 | 1.00 | 1.00 |
| 64 | 2 | 1 | - | 7596.32 | 2.52 | - | 1.00 |
| 32 | 1 | 4 | 12135.04 | 23660.14 | 1.95 | 4.02 | 3.11 |
| 16 | 1 | 8 | 20659.86 | 32175.41 | 1.56 | 6.85 | 4.24 |
Inference performance results
The following tables show inference statistics for the FastPitch and HiFi-GAN text-to-speech system, gathered from 100 inference runs. Latency is measured from the start of FastPitch inference to the end of HiFi-GAN inference. Throughput is measured as the number of generated audio samples per second at 22KHz. RTF is the real-time factor that denotes the number of seconds of speech generated in a second of wall-clock time per input utterance.
Our results were obtained by running the ./scripts/inference_benchmark.sh script in
the PyTorch 21.12-py3 NGC container. The input utterance has 128 characters, synthesized audio has 8.05 s.
Inference performance: NVIDIA DGX A100 (1x A100 80GB)
TorchScript + denoising:
| Batch size | Precision | Avg latency (s) | Latency tolerance interval 90% (s) | Latency tolerance interval 95% (s) | Latency tolerance interval 99% (s) | Throughput (samples/sec) | Speed-up with mixed precision | Avg RTF |
|---|---|---|---|---|---|---|---|---|
| 1 | FP16 | 0.019 | 0.021 | 0.021 | 0.022 | 8906958 | 1.29 | 403.94 |
| 2 | FP16 | 0.029 | 0.029 | 0.029 | 0.03 | 11780358 | 1.97 | 267.13 |
| 4 | FP16 | 0.044 | 0.045 | 0.045 | 0.046 | 15248417 | 1.57 | 172.88 |
| 8 | FP16 | 0.082 | 0.082 | 0.082 | 0.082 | 16597793 | 1.57 | 94.09 |
| 1 | TF32 | 0.025 | 0.025 | 0.025 | 0.025 | 6915487 | - | 313.63 |
| 2 | TF32 | 0.057 | 0.057 | 0.057 | 0.057 | 5966172 | - | 135.29 |
| 4 | TF32 | 0.07 | 0.071 | 0.071 | 0.072 | 9710162 | - | 110.09 |
| 8 | TF32 | 0.128 | 0.129 | 0.129 | 0.129 | 10578539 | - | 59.97 |
TorchScript, no denoising:
| Batch size | Precision | Avg latency (s) | Latency tolerance interval 90% (s) | Latency tolerance interval 95% (s) | Latency tolerance interval 99% (s) | Throughput (samples/sec) | Speed-up with mixed precision | Avg RTF |
|---|---|---|---|---|---|---|---|---|
| 1 | FP16 | 0.018 | 0.019 | 0.019 | 0.020 | 9480432 | 1.32 | 429.95 |
| 2 | FP16 | 0.027 | 0.028 | 0.028 | 0.028 | 12430026 | 2.02 | 281.86 |
| 4 | FP16 | 0.042 | 0.044 | 0.044 | 0.045 | 15952396 | 1.60 | 180.87 |
| 8 | FP16 | 0.082 | 0.083 | 0.083 | 0.084 | 16461910 | 1.52 | 93.32 |
| 1 | TF32 | 0.024 | 0.025 | 0.025 | 0.025 | 7194880 | - | 326.3 |
| 2 | TF32 | 0.055 | 0.056 | 0.056 | 0.056 | 6141659 | - | 139.27 |
| 4 | TF32 | 0.068 | 0.068 | 0.069 | 0.069 | 9977333 | - | 113.12 |
| 8 | TF32 | 0.125 | 0.126 | 0.126 | 0.127 | 10813904 | - | 61.3 |
Inference performance: NVIDIA DGX-1 (1x V100 16GB)
TorchScript + denoising:
| Batch size | Precision | Avg latency (s) | Latency tolerance interval 90% (s) | Latency tolerance interval 95% (s) | Latency tolerance interval 99% (s) | Throughput (samples/sec) | Speed-up with mixed precision | Avg RTF |
|---|---|---|---|---|---|---|---|---|
| 1 | FP16 | 0.033 | 0.034 | 0.035 | 0.035 | 5062222 | 1.82 | 229.58 |
| 4 | FP16 | 0.083 | 0.085 | 0.085 | 0.085 | 8106313 | 2.29 | 91.91 |
| 8 | FP16 | 0.142 | 0.144 | 0.144 | 0.145 | 9501139 | 2.54 | 53.86 |
| 1 | FP32 | 0.061 | 0.062 | 0.062 | 0.062 | 2783145 | - | 126.22 |
| 4 | FP32 | 0.192 | 0.194 | 0.194 | 0.195 | 3534640 | - | 40.08 |
| 8 | FP32 | 0.362 | 0.364 | 0.364 | 0.365 | 3747958 | - | 21.25 |
TorchScript, no denoising:
| Batch size | Precision | Avg latency (s) | Latency tolerance interval 90% (s) | Latency tolerance interval 95% (s) | Latency tolerance interval 99% (s) | Throughput (samples/sec) | Speed-up with mixed precision | Avg RTF |
|---|---|---|---|---|---|---|---|---|
| 1 | FP16 | 0.030 | 0.031 | 0.031 | 0.031 | 5673639 | 2.02 | 257.31 |
| 4 | FP16 | 0.080 | 0.081 | 0.081 | 0.082 | 8472603 | 2.37 | 96.06 |
| 8 | FP16 | 0.139 | 0.140 | 0.141 | 0.141 | 9737865 | 2.57 | 55.20 |
| 1 | FP32 | 0.060 | 0.061 | 0.061 | 0.062 | 2806620 | - | 127.28 |
| 4 | FP32 | 0.190 | 0.192 | 0.192 | 0.193 | 3571308 | - | 40.49 |
| 8 | FP32 | 0.358 | 0.360 | 0.361 | 0.361 | 3788591 | - | 21.48 |
Inference performance: NVIDIA T4
TorchScript, denoising:
| Batch size | Precision | Avg latency (s) | Latency tolerance interval 90% (s) | Latency tolerance interval 95% (s) | Latency tolerance interval 99% (s) | Throughput (samples/sec) | Speed-up with mixed precision | Avg RTF |
|---|---|---|---|---|---|---|---|---|
| 1 | FP16 | 0.060 | 0.061 | 0.061 | 0.061 | 2835064 | 2.42 | 128.57 |
| 4 | FP16 | 0.211 | 0.213 | 0.213 | 0.214 | 3205667 | 2.42 | 36.35 |
| 8 | FP16 | 0.410 | 0.413 | 0.413 | 0.414 | 3304070 | 2.45 | 18.73 |
| 1 | FP32 | 0.145 | 0.146 | 0.147 | 0.147 | 1171258 | - | 53.12 |
| 4 | FP32 | 0.512 | 0.515 | 0.515 | 0.516 | 1324952 | - | 15.02 |
| 8 | FP32 | 1.006 | 1.011 | 1.012 | 1.013 | 1347688 | - | 7.64 |
TorchScript, no denoising:
| Batch size | Precision | Avg latency (s) | Latency tolerance interval 90% (s) | Latency tolerance interval 95% (s) | Latency tolerance interval 99% (s) | Throughput (samples/sec) | Speed-up with mixed precision | Avg RTF |
|---|---|---|---|---|---|---|---|---|
| 1 | FP16 | 0.057 | 0.058 | 0.058 | 0.059 | 2969398 | 2.48 | 134.67 |
| 4 | FP16 | 0.205 | 0.207 | 0.207 | 0.208 | 3299130 | 2.45 | 37.41 |
| 8 | FP16 | 0.399 | 0.402 | 0.403 | 0.404 | 3389001 | 2.48 | 19.21 |
| 1 | FP32 | 0.142 | 0.143 | 0.143 | 0.144 | 1195309 | - | 54.21 |
| 4 | FP32 | 0.504 | 0.507 | 0.507 | 0.509 | 1345995 | - | 15.26 |
| 8 | FP32 | 0.993 | 0.997 | 0.998 | 0.999 | 1365273 | - | 7.74 |