Transformer-XL is a transformer-based language model with a segment-level recurrence and a novel relative positional encoding.
The performance measurements in this document were conducted at the time of publication and may not reflect the performance achieved from NVIDIA's latest software release. For the most up-to-date performance measurements, go to NVIDIA Data Center Deep Learning Product Performance.
Benchmarking
The following section shows how to run benchmarks measuring the model performance in training and inference modes.
Training performance benchmark
To benchmark the training performance on a specific global batch size <BS>,
with a specific number of GPUs <#GPUs> for a specific number of training
iterations <ITER> run:
For the base model:
bash run_wt103_base.sh train <#GPUs> --train_batch_size <BS> --train_steps <ITER> --log_interval 1 [--amp] [--batch_chunk CHUNK]
It's recommended to launch at least 1500 training steps to get a reliable estimate of training performance. For more information about the available options, refer to the Training process section.
The training script prints information in the following format:
(...)
[1,0]<stderr>:INFO:tensorflow:step 99 | lr 0.000990000 | loss 9.22 | pplx 10069.60, bpc 13.2977, tok/s 136092
[1,0]<stderr>:I0109 12:18:41.333325 140403024426816 main.py:333] step 99 | lr 0.000990000 | loss 9.22 | pplx 10069.60,
bpc 13.2977, tok/s 136092
[1,0]<stderr>:INFO:tensorflow:step 100 | lr 0.001000000 | loss 9.21 | pplx 9981.87, bpc 13.2851, tok/s 135309
[1,0]<stderr>:I0109 12:18:41.696926 140403024426816 main.py:333] step 100 | lr 0.001000000 | loss 9.21 | pplx 9981.87,
bpc 13.2851, tok/s 135309
(...)
[1,0]<stderr>:INFO:tensorflow:Training throughput: 135959 tok/s
The last two lines contain information on the average training throughput measured in tokens per second.
Inference performance benchmark
The inference performance and accuracy benchmarks require a checkpoint from a trained model.
To benchmark the inference performance on a specific global batch size <BS>, run:
bash run_wt103_base.sh eval --model_dir <CHECKPOINT_DIR> --eval_batch_size <BS> [--amp]
The inference script prints information in the following format:
I0109 13:02:31.304439 139903273469760 main.py:440] Evaluating with: math fp16
INFO:tensorflow:| loss 3.15 | pplx   23.32, bpc  4.5432, tok/s   9946, ms/batch 102.84
The output contains information on the achieved test loss and test perplexity, average inference throughput (measured in tokens per second), average inference latency (measured in milliseconds).
Results
The following sections provide details on how we achieved our performance and accuracy in training and inference.
Training accuracy results
Training accuracy: NVIDIA DGX A100 (8x A100 40GB)
Base model
Our results were obtained by running the tf/run_wt103_base.sh
training script in the tensorflow:20.06-tf1-py3 NGC container on NVIDIA DGX A100
with8x A100 40GB GPUs.
| GPUs | Batch Size / GPU | Accuracy - TF32 (perplexity) | Accuracy - Mixed precision (perplexity) | Time to Train - TF32 (minutes) | Time to Train - Mixed precision (minutes) | Time to Train Speedup (TF32 to Mixed precision) |
|---|---|---|---|---|---|---|
| 1 | 16 | 23.53 | 23.50 | 960 | 880 | 1.09 |
| 8 | 16 | 23.45 | 23.48 | 150 | 142 | 1.06 |
Training accuracy: NVIDIA DGX-1 (8x V100 16GB)
Base model
Our results were obtained by running the tf/run_wt103_base.sh
training script in the tensorflow:20.06-tf1-py3 NGC container on NVIDIA DGX-1
with 8x V100 16G GPUs.
| GPUs | Batch Size / GPU | Accuracy - FP32 (perplexity) | Accuracy - Mixed precision (perplexity) | Time to Train - FP32 (minutes) | Time to Train - Mixed precision (minutes) | Time to Train Speedup (FP32 to Mixed precision) |
|---|---|---|---|---|---|---|
| 1 | 16 | 23.64 | 23.58 | 2949 | 2021 | 1.46 |
| 8 | 16 | 23.35 | 23.34 | 459 | 343 | 1.34 |
Training accuracy: NVIDIA DGX-2 (16x V100 32GB)
Base model
Our results were obtained by running the tf/run_wt103_base.sh
training script in the tensorflow:20.06-tf1-py3 NGC container on NVIDIA DGX-2
with 16x V100 32G GPUs.
| GPUs | Batch Size / GPU | Accuracy - FP32 (perplexity) | Accuracy - Mixed precision (perplexity) | Time to Train - FP32 (minutes) | Time to Train - Mixed precision (minutes) | Time to Train Speedup (FP32 to Mixed precision) |
|---|---|---|---|---|---|---|
| 16 | 16 | 23.39 | 23.37 | 202 | 161 | 1.25 |
| 8 | 32 | 23.33 | 23.40 | 330 | 227 | 1.46 |
Training loss plot
Base model
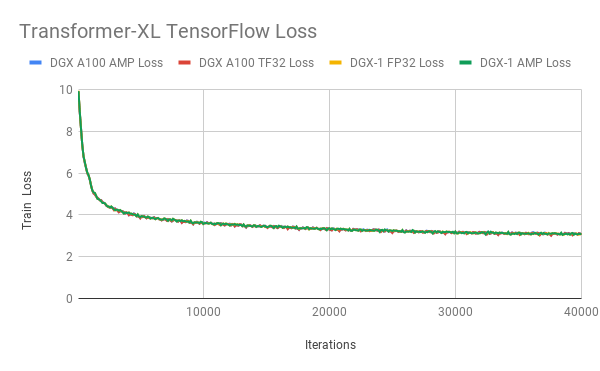
Training stability test
Base model
The Transformer-XL base model was trained for 40,000 training steps, starting from 20 different initial random seeds. The training was performed in the tensorflow:20.06-tf1-py3 NGC container on NVIDIA DGX-1 with 8x V100 16G GPUs. After training, the models were evaluated on the test dataset. The following table summarizes the final perplexity on the test set.
| Average perplexity | Standard deviation | Minimum | Maximum | Median |
|---|---|---|---|---|
| 23.38 | 0.0879 | 23.24 | 23.58 | 23.39 |
Training performance results
Training performance: NVIDIA DGX A100 (8x A100 40GB)
Our results were obtained by running the tf/run_wt103_base.sh
training script in the tensorflow:20.06-tf1-py3 NGC container on NVIDIA DGX A100
with 8x A100 40GB GPUs. Performance numbers (in tokens per second) were averaged over 2000
training iterations.
| GPUs | Batch Size / GPU | Throughput - TF32 (tok/s) | Throughput - Mixed precision (tok/s) | Throughput speedup (TF32 to Mixed precision) | Weak Scaling - TF32 | Weak Scaling - Mixed precision |
|---|---|---|---|---|---|---|
| 1 | 16 | 25,127 | 26,130 | 1.040 | 1.000 | 1.000 |
| 1 | 32 | 30,958 | 33,117 | 1.070 | 1.000 | 1.000 |
| 1 | 64 | 34,244 | 36,455 | 1.065 | 1.000 | 1.000 |
| 8 | 16 | 157,538 | 155,656 | 0.988 | 6.270 | 5.957 |
| 8 | 32 | 224,474 | 227,502 | 1.013 | 7.251 | 6.870 |
To achieve these same results, follow the steps in the Quick Start Guide.
Training performance: NVIDIA DGX-1 (8x V100 16GB)
Base model
Our results were obtained by running the tf/run_wt103_base.sh
training script in the tensorflow:20.06-tf1-py3 NGC container on NVIDIA DGX-1 with 8x
V100 16G GPUs. Performance numbers (in tokens per second) were averaged over 2000
training iterations.
| GPUs | Batch Size / GPU | Throughput - FP32 (tok/s) | Throughput - Mixed precision (tok/s) | Throughput speedup (FP32 to Mixed precision) | Weak Scaling - FP32 | Weak Scaling - Mixed precision |
|---|---|---|---|---|---|---|
| 1 | 16 | 9,104 | 13,004 | 1.428 | 1.000 | 1.000 |
| 2 | 16 | 18,169 | 23,856 | 1.313 | 1.996 | 1.835 |
| 4 | 16 | 38,876 | 50,310 | 1.294 | 4.270 | 3.869 |
| 8 | 16 | 78,626 | 101,954 | 1.297 | 8.636 | 7.840 |
To achieve these same results, follow the steps in the Quick Start Guide.
Training performance: NVIDIA DGX-2 (16x V100 32GB)
Base model
Our results were obtained by running the tf/run_wt103_base.sh training
script in the tensorflow:20.06-tf1-py3 NGC container on NVIDIA DGX-2 with 16x V100 32G
GPUs. Performance numbers (in tokens per second) were averaged over 2000
training iterations.
| GPUs | Batch Size / GPU | Throughput - FP32 (tok/s) | Throughput - Mixed precision (tok/s) | Throughput speedup (FP32 to Mixed precision) | Weak Scaling - FP32 | Weak Scaling - Mixed precision |
|---|---|---|---|---|---|---|
| 1 | 16 | 9,891 | 13,791 | 1.394 | 1.000 | 1.000 |
| 2 | 16 | 21,550 | 28,306 | 1.314 | 2.179 | 2.052 |
| 4 | 16 | 42,616 | 55,430 | 1.301 | 4.309 | 4.019 |
| 8 | 16 | 83,932 | 107,999 | 1.287 | 8.486 | 7.831 |
| 16 | 16 | 164,675 | 206,906 | 1.256 | 16.649 | 15.003 |
To achieve these same results, follow the steps in the Quick Start Guide.
Inference performance results
Inference performance: NVIDIA DGX A100 (1x A100 40GB)
Base model
Our results were obtained by running the
tf/scripts/inference_benchmark.sh inferencing benchmarking script in the
tensorflow:20.06-tf1-py3 NGC container on NVIDIA DGX A100 (1x A100 40GB) GPU.
The command to launch the inference performance benchmark is provided in the Inference performance benchmark section.
FP16
| Batch size | Sequence length | Memory length | Throughput Avg (tok/s) | Latency Avg (ms) | Latency 90% (ms) | Latency 95% (ms) | Latency 99% (ms) |
|---|---|---|---|---|---|---|---|
| 1 | 64 | 640 | 2592.8 | 24.71 | 25.72 | 26.12 | 26.68 |
| 2 | 64 | 640 | 5060.4 | 25.32 | 26.58 | 26.93 | 27.71 |
| 4 | 64 | 640 | 8910.2 | 28.73 | 29.74 | 30.06 | 30.58 |
| 8 | 64 | 640 | 13844.1 | 36.96 | 37.62 | 37.80 | 38.34 |
| 16 | 64 | 640 | 18313.1 | 55.92 | 56.46 | 56.69 | 57.39 |
| 32 | 64 | 640 | 21854.7 | 93.63 | 94.37 | 94.74 | 94.92 |
TF32
| Batch size | Sequence length | Memory length | Throughput Avg (tok/s) | Latency Avg (ms) | Latency 90% (ms) | Latency 95% (ms) | Latency 99% (ms) |
|---|---|---|---|---|---|---|---|
| 1 | 64 | 640 | 2587.6 | 24.75 | 25.63 | 25.92 | 26.44 |
| 2 | 64 | 640 | 5177.8 | 24.73 | 25.71 | 26.03 | 26.56 |
| 4 | 64 | 640 | 9113.6 | 28.09 | 29.40 | 29.71 | 30.07 |
| 8 | 64 | 640 | 13371.7 | 38.27 | 38.95 | 39.34 | 40.07 |
| 16 | 64 | 640 | 16971.0 | 60.29 | 60.88 | 61.13 | 61.73 |
| 32 | 64 | 640 | 19434.5 | 105.29 | 106.00 | 106.19 | 106.79 |
To achieve these same results, follow the steps in the Quick Start Guide.
Inference performance: NVIDIA DGX-1 (1x V100 16GB)
Base model
Our results were obtained by running the
tf/scripts/inference_benchmark.sh inferencing benchmarking script in the
tensorflow:20.06-tf1-py3 NGC container on NVIDIA DGX-1 with 1x V100 16G GPU.
The command to launch the inference performance benchmark is provided in the Inference performance benchmark section.
FP16
| Batch size | Sequence length | Memory length | Throughput Avg (tok/s) | Latency Avg (ms) | Latency 90% (ms) | Latency 95% (ms) | Latency 99% (ms) |
|---|---|---|---|---|---|---|---|
| 1 | 64 | 640 | 1823.8 | 35.17 | 37.27 | 38.22 | 41.28 |
| 2 | 64 | 640 | 3337.6 | 38.46 | 41.09 | 41.94 | 43.91 |
| 4 | 64 | 640 | 5354.0 | 47.83 | 49.74 | 50.54 | 53.08 |
| 8 | 64 | 640 | 7779.7 | 65.79 | 67.71 | 68.37 | 69.71 |
| 16 | 64 | 640 | 9796.5 | 104.46 | 107.22 | 108.07 | 108.69 |
| 32 | 64 | 640 | 11215.5 | 182.45 | 184.11 | 184.49 | 186.92 |
FP32
| Batch size | Sequence length | Memory length | Throughput Avg (tok/s) | Latency Avg (ms) | Latency 90% (ms) | Latency 95% (ms) | Latency 99% (ms) |
|---|---|---|---|---|---|---|---|
| 1 | 64 | 640 | 1912.7 | 33.56 | 35.98 | 36.84 | 38.96 |
| 2 | 64 | 640 | 3497.0 | 36.66 | 39.07 | 39.85 | 41.28 |
| 4 | 64 | 640 | 4732.9 | 54.10 | 56.32 | 57.10 | 58.14 |
| 8 | 64 | 640 | 6303.7 | 81.19 | 83.32 | 84.02 | 88.12 |
| 16 | 64 | 640 | 7676.3 | 133.29 | 134.84 | 135.33 | 136.70 |
| 32 | 64 | 640 | 8555.6 | 239.15 | 240.02 | 240.20 | 240.48 |
To achieve these same results, follow the steps in the Quick Start Guide.
Inference performance: NVIDIA T4
Base model
Our results were obtained by running the
tf/scripts/inference_benchmark.sh inferencing benchmarking script in the
tensorflow:20.06-tf1-py3 NGC container on NVIDIA T4.
The command to launch the inference performance benchmark is provided in the Inference performance benchmark section.
FP16
| Batch size | Sequence length | Memory length | Throughput Avg (tok/s) | Latency Avg (ms) | Latency 90% (ms) | Latency 95% (ms) | Latency 99% (ms) |
|---|---|---|---|---|---|---|---|
| 1 | 64 | 640 | 1228.6 | 52.21 | 55.14 | 56.32 | 59.77 |
| 2 | 64 | 640 | 2108.5 | 60.78 | 63.62 | 64.68 | 67.07 |
| 4 | 64 | 640 | 3376.7 | 75.83 | 78.77 | 79.63 | 82.80 |
| 8 | 64 | 640 | 4666.3 | 109.69 | 112.58 | 113.88 | 117.35 |
| 16 | 64 | 640 | 5557.0 | 184.14 | 186.51 | 187.20 | 189.64 |
| 32 | 64 | 640 | 6174.3 | 331.41 | 333.67 | 334.94 | 336.90 |
FP32
| Batch size | Sequence length | Memory length | Throughput Avg (tok/s) | Latency Avg (ms) | Latency 90% (ms) | Latency 95% (ms) | Latency 99% (ms) |
|---|---|---|---|---|---|---|---|
| 1 | 64 | 640 | 1029.7 | 62.28 | 65.82 | 66.93 | 70.22 |
| 2 | 64 | 640 | 1667.7 | 76.81 | 79.80 | 80.71 | 84.35 |
| 4 | 64 | 640 | 2302.3 | 111.13 | 113.75 | 114.85 | 118.57 |
| 8 | 64 | 640 | 2756.9 | 185.58 | 188.16 | 189.38 | 192.68 |
| 16 | 64 | 640 | 3188.8 | 320.86 | 324.24 | 325.63 | 327.76 |
| 32 | 64 | 640 | 3439.1 | 594.96 | 599.13 | 599.89 | 602.59 |
To achieve these same results, follow the steps in the Quick Start Guide.