
The GNMT v2 model is an improved version of the first Google's Neural Machine Translation System with a modified attention mechanism.
The performance measurements in this document were conducted at the time of publication and may not reflect the performance achieved from NVIDIA's latest software release. For the most up-to-date performance measurements, go to NVIDIA Data Center Deep Learning Product Performance.
Benchmarking
The following section shows how to run benchmarks measuring the model performance in training and inference modes.
Training performance benchmark
Training is launched on batches of text data, different batches have different sequence lengths (number of tokens in the longest sequence). Sequence length and batch efficiency (ratio of non-pad tokens to total number of tokens) affect performance of the training, therefore it's recommended to run the training on a large chunk of training dataset to get a stable and reliable average training performance. Ideally at least one full epoch of training should be launched to get a good estimate of training performance.
The following commands will launch one epoch of training:
To launch mixed precision training on 1, 4 or 8 GPUs, run:
python3 -m torch.distributed.launch --nproc_per_node=<#GPUs> train.py --seed 2 --train-global-batch-size 1024 --epochs 1 --math fp16
To launch mixed precision training on 16 GPUs, run:
python3 -m torch.distributed.launch --nproc_per_node=16 train.py --seed 2 --train-global-batch-size 2048 --epochs 1 --math fp16
Change --math fp16 to --math fp32 to launch single precision training (for
NVIDIA Volta and NVIDIA Turing architectures) or to --math tf32 to launch
TF32 training with Tensor Cores (for NVIDIA Ampere architecture).
After the training is completed, the train.py script prints a summary to
standard output. Performance results are printed in the following format:
(...)
0: Performance: Epoch: 0	Training: 418926 Tok/s	Validation: 1430828 Tok/s
(...)
Training: 418926 Tok/s represents training throughput averaged over an entire
training epoch and summed over all GPUs participating in the training.
Inference performance benchmark
The inference performance and accuracy benchmarks require a checkpoint from a fully trained model.
Command to launch the inference accuracy benchmark on NVIDIA Volta or on NVIDIA Turing architectures:
python3 translate.py \
  --model gnmt/model_best.pth \
  --input data/wmt16_de_en/newstest2014.en \
  --reference data/wmt16_de_en/newstest2014.de \
  --output /tmp/output \
  --math fp16 fp32 \
  --batch-size 128 \
  --beam-size 1 2 5 \
  --tables
Command to launch the inference accuracy benchmark on NVIDIA Ampere architecture:
python3 translate.py \
  --model gnmt/model_best.pth \
  --input data/wmt16_de_en/newstest2014.en \
  --reference data/wmt16_de_en/newstest2014.de \
  --output /tmp/output \
  --math fp16 tf32 \
  --batch-size 128 \
  --beam-size 1 2 5 \
  --tables
Command to launch the inference throughput and latency benchmarks on NVIDIA Volta or NVIDIA Turing architectures:
python3 translate.py \
  --model gnmt/model_best.pth \
  --input data/wmt16_de_en/newstest2014.en \
  --reference data/wmt16_de_en/newstest2014.de \
  --output /tmp/output \
  --math fp16 fp32 \
  --batch-size 1 2 4 8 32 128 512 \
  --repeat 1 1 1 1 2 8 16 \
  --beam-size 1 2 5 \
  --warmup 5 \
  --tables
Command to launch the inference throughput and latency benchmarks on NVIDIA Ampere architecture:
python3 translate.py \
  --model gnmt/model_best.pth \
  --input data/wmt16_de_en/newstest2014.en \
  --reference data/wmt16_de_en/newstest2014.de \
  --output /tmp/output \
  --math fp16 tf32 \
  --batch-size 1 2 4 8 32 128 512 \
  --repeat 1 1 1 1 2 8 16 \
  --beam-size 1 2 5 \
  --warmup 5 \
  --tables
Results
The following sections provide details on how we achieved our performance and accuracy in training and inference.
Training accuracy results
Training accuracy: NVIDIA DGX A100 (8x A100 40GB)
Our results were obtained by running the train.py script with the default
batch size = 128 per GPU in the pytorch-20.06-py3 NGC container on NVIDIA DGX
A100 with 8x A100 40GB GPUs.
Command to launch the training:
python3 -m torch.distributed.launch --nproc_per_node=<#GPUs> train.py --seed 2 --train-global-batch-size 1024 --math fp16
Change --math fp16 to --math tf32 to launch TF32 training with Tensor Cores.
| GPUs | Batch Size / GPU | Accuracy - TF32 (BLEU) | Accuracy - Mixed precision (BLEU) | Time to Train - TF32 (minutes) | Time to Train - Mixed precision (minutes) | Time to Train Speedup (TF32 to Mixed precision) |
|---|---|---|---|---|---|---|
| 8 | 128 | 24.46 | 24.60 | 34.7 | 22.7 | 1.53 |
To achieve these same results, follow the Quick Start Guide outlined above.
Training accuracy: NVIDIA DGX-1 (8x V100 16GB)
Our results were obtained by running the train.py script with the default
batch size = 128 per GPU in the pytorch-20.06-py3 NGC container on NVIDIA DGX-1
with 8x V100 16GB GPUs.
Command to launch the training:
python3 -m torch.distributed.launch --nproc_per_node=<#GPUs> train.py --seed 2 --train-global-batch-size 1024 --math fp16
Change --math fp16 to --math fp32 to launch single precision training.
| GPUs | Batch Size / GPU | Accuracy - FP32 (BLEU) | Accuracy - Mixed precision (BLEU) | Time to Train - FP32 (minutes) | Time to Train - Mixed precision (minutes) | Time to Train Speedup (FP32 to Mixed precision) |
|---|---|---|---|---|---|---|
| 1 | 128 | 24.41 | 24.42 | 810.0 | 224.0 | 3.62 |
| 4 | 128 | 24.40 | 24.33 | 218.2 | 69.5 | 3.14 |
| 8 | 128 | 24.45 | 24.38 | 112.0 | 38.6 | 2.90 |
To achieve these same results, follow the Quick Start Guide outlined above.
Training accuracy: NVIDIA DGX-2H (16x V100 32GB)
Our results were obtained by running the train.py script with the default
batch size = 128 per GPU in the pytorch-20.06-py3 NGC container on NVIDIA DGX-2H
with 16x V100 32GB GPUs.
To launch mixed precision training on 16 GPUs, run:
python3 -m torch.distributed.launch --nproc_per_node=16 train.py --seed 2 --train-global-batch-size 2048 --math fp16
Change --math fp16 to --math fp32 to launch single precision training.
| GPUs | Batch Size / GPU | Accuracy - FP32 (BLEU) | Accuracy - Mixed precision (BLEU) | Time to Train - FP32 (minutes) | Time to Train - Mixed precision (minutes) | Time to Train Speedup (FP32 to Mixed precision) |
|---|---|---|---|---|---|---|
| 16 | 128 | 24.41 | 24.38 | 52.1 | 19.4 | 2.69 |
To achieve these same results, follow the Quick Start Guide outlined above.
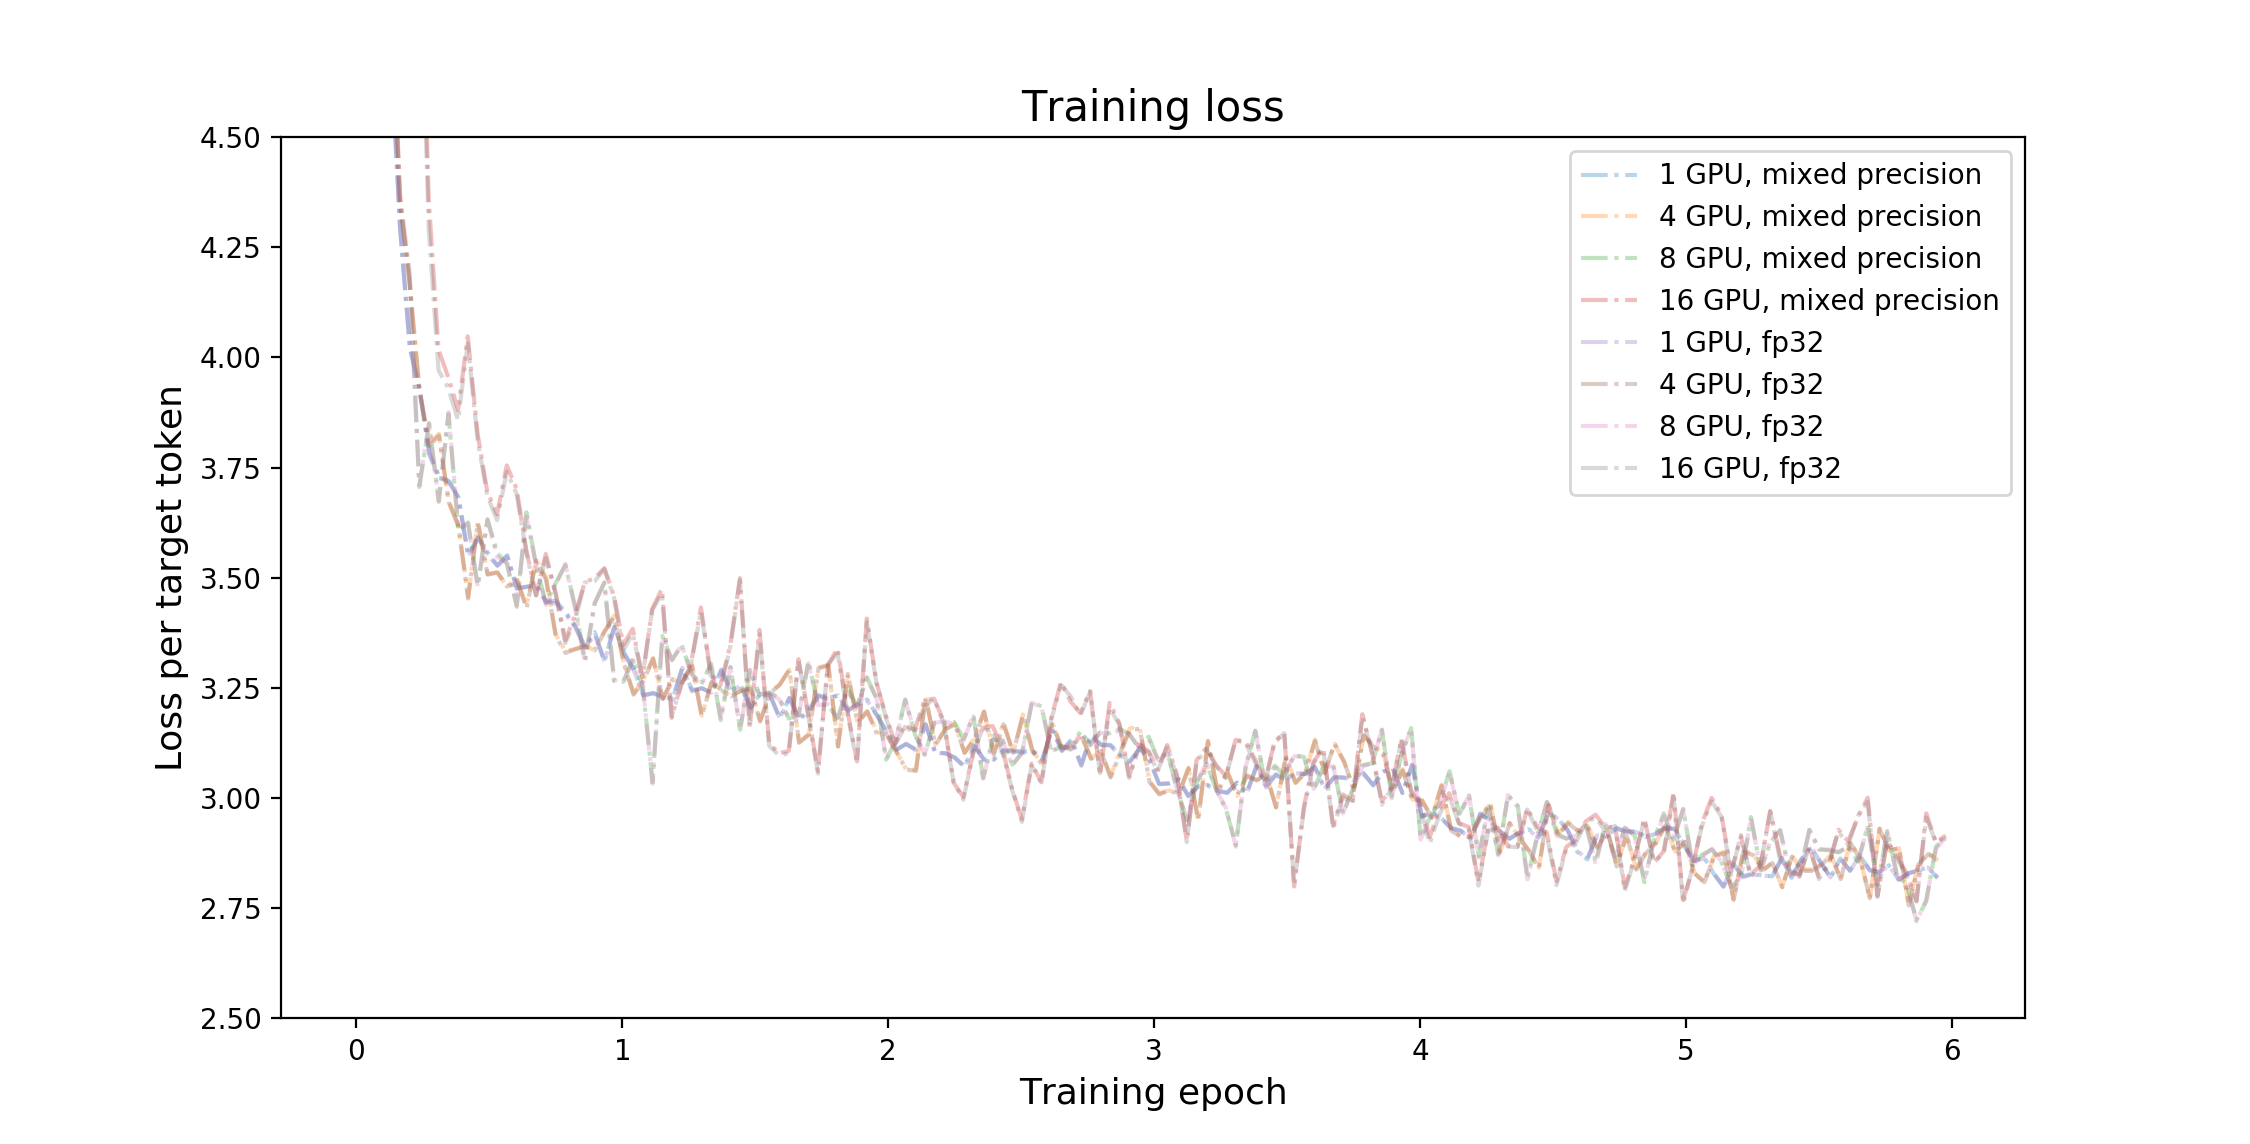
Training stability test
The GNMT v2 model was trained for 6 epochs, starting from 32 different initial random seeds. After each training epoch, the model was evaluated on the test dataset and the BLEU score was recorded. The training was performed in the pytorch-20.06-py3 Docker container on NVIDIA DGX A100 with 8x A100 40GB GPUs. The following table summarizes the results of the stability test.
In the following table, the BLEU scores after each training epoch for different initial random seeds are displayed.
| Epoch | Average | Standard deviation | Minimum | Maximum | Median |
|---|---|---|---|---|---|
| 1 | 19.959 | 0.238 | 19.410 | 20.390 | 19.970 |
| 2 | 21.772 | 0.293 | 20.960 | 22.280 | 21.820 |
| 3 | 22.435 | 0.264 | 21.740 | 22.870 | 22.465 |
| 4 | 23.167 | 0.166 | 22.870 | 23.620 | 23.195 |
| 5 | 24.233 | 0.149 | 23.820 | 24.530 | 24.235 |
| 6 | 24.416 | 0.131 | 24.140 | 24.660 | 24.390 |
Training throughput results
Training throughput: NVIDIA DGX A100 (8x A100 40GB)
Our results were obtained by running the train.py training script in the
pytorch-20.06-py3 NGC container on NVIDIA DGX A100 with 8x A100 40GB GPUs.
Throughput performance numbers (in tokens per second) were averaged over an
entire training epoch.
| GPUs | Batch size / GPU | Throughput - TF32 (tok/s) | Throughput - Mixed precision (tok/s) | Throughput speedup (TF32 to Mixed precision) | Strong Scaling - TF32 | Strong Scaling - Mixed precision |
|---|---|---|---|---|---|---|
| 1 | 128 | 83214 | 140909 | 1.693 | 1.000 | 1.000 |
| 4 | 128 | 278576 | 463144 | 1.663 | 3.348 | 3.287 |
| 8 | 128 | 519952 | 822024 | 1.581 | 6.248 | 5.834 |
To achieve these same results, follow the Quick Start Guide outlined above.
Training throughput: NVIDIA DGX-1 (8x V100 16GB)
Our results were obtained by running the train.py training script in the
pytorch-20.06-py3 NGC container on NVIDIA DGX-1 with 8x V100 16GB GPUs.
Throughput performance numbers (in tokens per second) were averaged over an
entire training epoch.
| GPUs | Batch size / GPU | Throughput - FP32 (tok/s) | Throughput - Mixed precision (tok/s) | Throughput speedup (FP32 to Mixed precision) | Strong Scaling - FP32 | Strong Scaling - Mixed precision |
|---|---|---|---|---|---|---|
| 1 | 128 | 21860 | 76438 | 3.497 | 1.000 | 1.000 |
| 4 | 128 | 80224 | 249168 | 3.106 | 3.670 | 3.260 |
| 8 | 128 | 154168 | 447832 | 2.905 | 7.053 | 5.859 |
To achieve these same results, follow the Quick Start Guide outlined above.
Training throughput: NVIDIA DGX-2H (16x V100 32GB)
Our results were obtained by running the train.py training script in the
pytorch-20.06-py3 NGC container on NVIDIA DGX-2H with 16x V100 32GB GPUs.
Throughput performance numbers (in tokens per second) were averaged over an
entire training epoch.
| GPUs | Batch size / GPU | Throughput - FP32 (tok/s) | Throughput - Mixed precision (tok/s) | Throughput speedup (FP32 to Mixed precision) | Strong Scaling - FP32 | Strong Scaling - Mixed precision |
|---|---|---|---|---|---|---|
| 1 | 128 | 25583 | 87829 | 3.433 | 1.000 | 1.000 |
| 4 | 128 | 91400 | 290640 | 3.180 | 3.573 | 3.309 |
| 8 | 128 | 176616 | 522008 | 2.956 | 6.904 | 5.943 |
| 16 | 128 | 351792 | 1010880 | 2.874 | 13.751 | 11.510 |
To achieve these same results, follow the Quick Start Guide outlined above.
Inference accuracy results
Inference accuracy: NVIDIA A100 40GB
Our results were obtained by running the translate.py script in the
pytorch-20.06-py3 NGC Docker container with NVIDIA A100 40GB GPU. Full
command to launch the inference accuracy benchmark was provided in the
Inference performance benchmark section.
| Batch Size | Beam Size | Accuracy - TF32 (BLEU) | Accuracy - FP16 (BLEU) |
|---|---|---|---|
| 128 | 1 | 23.07 | 23.07 |
| 128 | 2 | 23.81 | 23.81 |
| 128 | 5 | 24.41 | 24.43 |
Inference accuracy: NVIDIA Tesla V100 16GB
Our results were obtained by running the translate.py script in the
pytorch-20.06-py3 NGC Docker container with NVIDIA Tesla V100 16GB GPU. Full
command to launch the inference accuracy benchmark was provided in the
Inference performance benchmark section.
| Batch Size | Beam Size | Accuracy - FP32 (BLEU) | Accuracy - FP16 (BLEU) |
|---|---|---|---|
| 128 | 1 | 23.07 | 23.07 |
| 128 | 2 | 23.81 | 23.79 |
| 128 | 5 | 24.40 | 24.43 |
Inference accuracy: NVIDIA T4
Our results were obtained by running the translate.py script in the
pytorch-20.06-py3 NGC Docker container with NVIDIA Tesla T4. Full command to
launch the inference accuracy benchmark was provided in the Inference
performance benchmark section.
| Batch Size | Beam Size | Accuracy - FP32 (BLEU) | Accuracy - FP16 (BLEU) |
|---|---|---|---|
| 128 | 1 | 23.07 | 23.08 |
| 128 | 2 | 23.81 | 23.80 |
| 128 | 5 | 24.40 | 24.39 |
To achieve these same results, follow the Quick Start Guide outlined above.
Inference throughput results
Tables presented in this section show the average inference throughput (columns
Avg (tok/s)) and inference throughput for various confidence intervals
(columns N% (ms), where N denotes the confidence interval). Inference
throughput is measured in tokens per second. Speedups reported in FP16
subsections are relative to FP32 (for NVIDIA Volta and NVIDIA Turing) and
relative to TF32 (for NVIDIA Ampere) numbers for corresponding configuration.
Inference throughput: NVIDIA A100 40GB
Our results were obtained by running the translate.py script in the
pytorch-20.06-py3 NGC Docker container with NVIDIA A100 40GB.
Full command to launch the inference throughput benchmark was provided in the
Inference performance benchmark section.
FP16
| Batch Size | Beam Size | Avg (tok/s) | Speedup | 90% (tok/s) | Speedup | 95% (tok/s) | Speedup | 99% (tok/s) | Speedup |
|---|---|---|---|---|---|---|---|---|---|
| 1 | 1 | 1291.6 | 1.031 | 1195.7 | 1.029 | 1165.8 | 1.029 | 1104.7 | 1.030 |
| 1 | 2 | 882.7 | 1.019 | 803.4 | 1.015 | 769.2 | 1.015 | 696.7 | 1.017 |
| 1 | 5 | 848.3 | 1.042 | 753.0 | 1.037 | 715.0 | 1.043 | 636.4 | 1.033 |
| 2 | 1 | 2060.5 | 1.034 | 1700.8 | 1.032 | 1621.8 | 1.032 | 1487.4 | 1.022 |
| 2 | 2 | 1445.7 | 1.026 | 1197.6 | 1.024 | 1132.5 | 1.023 | 1043.7 | 1.033 |
| 2 | 5 | 1402.3 | 1.063 | 1152.4 | 1.056 | 1100.5 | 1.053 | 992.9 | 1.053 |
| 4 | 1 | 3465.6 | 1.046 | 2838.3 | 1.040 | 2672.7 | 1.043 | 2392.8 | 1.043 |
| 4 | 2 | 2425.4 | 1.041 | 2002.5 | 1.028 | 1898.3 | 1.033 | 1690.2 | 1.028 |
| 4 | 5 | 2364.4 | 1.075 | 1930.0 | 1.067 | 1822.0 | 1.065 | 1626.1 | 1.058 |
| 8 | 1 | 6151.1 | 1.099 | 5078.0 | 1.087 | 4786.5 | 1.096 | 4206.9 | 1.090 |
| 8 | 2 | 4241.9 | 1.075 | 3494.1 | 1.066 | 3293.6 | 1.066 | 2970.9 | 1.064 |
| 8 | 5 | 4117.7 | 1.118 | 3430.9 | 1.103 | 3224.5 | 1.104 | 2833.5 | 1.110 |
| 32 | 1 | 18830.4 | 1.147 | 16210.0 | 1.152 | 15563.9 | 1.138 | 13973.2 | 1.135 |
| 32 | 2 | 12698.2 | 1.133 | 10812.3 | 1.114 | 10256.1 | 1.145 | 9330.2 | 1.101 |
| 32 | 5 | 11802.6 | 1.355 | 9998.8 | 1.318 | 9671.6 | 1.329 | 9058.4 | 1.335 |
| 128 | 1 | 53394.5 | 1.350 | 48867.6 | 1.342 | 46898.5 | 1.414 | 40670.6 | 1.305 |
| 128 | 2 | 34876.4 | 1.483 | 31687.4 | 1.491 | 30025.4 | 1.505 | 27677.1 | 1.421 |
| 128 | 5 | 28201.3 | 1.986 | 25660.5 | 1.997 | 24306.0 | 1.967 | 23326.2 | 2.007 |
| 512 | 1 | 119675.3 | 1.904 | 112400.5 | 1.971 | 109694.8 | 1.927 | 108781.3 | 1.919 |
| 512 | 2 | 74514.7 | 2.126 | 69578.9 | 2.209 | 69348.1 | 2.210 | 69253.7 | 2.212 |
| 512 | 5 | 47003.2 | 2.760 | 43348.2 | 2.893 | 43080.3 | 2.884 | 42878.4 | 2.881 |
Inference throughput: NVIDIA T4
Our results were obtained by running the translate.py script in the
pytorch-20.06-py3 NGC Docker container with NVIDIA T4.
Full command to launch the inference throughput benchmark was provided in the
Inference performance benchmark section.
FP16
| Batch Size | Beam Size | Avg (tok/s) | Speedup | 90% (tok/s) | Speedup | 95% (tok/s) | Speedup | 99% (tok/s) | Speedup |
|---|---|---|---|---|---|---|---|---|---|
| 1 | 1 | 1133.8 | 1.266 | 1059.1 | 1.253 | 1036.6 | 1.251 | 989.5 | 1.242 |
| 1 | 2 | 793.9 | 1.169 | 728.3 | 1.165 | 698.1 | 1.163 | 637.1 | 1.157 |
| 1 | 5 | 766.8 | 1.343 | 685.6 | 1.335 | 649.3 | 1.335 | 584.1 | 1.318 |
| 2 | 1 | 1759.8 | 1.233 | 1461.6 | 1.239 | 1402.3 | 1.242 | 1302.1 | 1.242 |
| 2 | 2 | 1313.3 | 1.186 | 1088.7 | 1.185 | 1031.6 | 1.180 | 953.2 | 1.178 |
| 2 | 5 | 1257.2 | 1.301 | 1034.1 | 1.316 | 990.3 | 1.313 | 886.3 | 1.265 |
| 4 | 1 | 2974.0 | 1.261 | 2440.3 | 1.255 | 2294.6 | 1.257 | 2087.7 | 1.261 |
| 4 | 2 | 2204.7 | 1.320 | 1826.3 | 1.283 | 1718.9 | 1.260 | 1548.4 | 1.260 |
| 4 | 5 | 2106.1 | 1.340 | 1727.8 | 1.345 | 1625.7 | 1.353 | 1467.7 | 1.346 |
| 8 | 1 | 5076.6 | 1.423 | 4207.9 | 1.367 | 3904.4 | 1.360 | 3475.3 | 1.355 |
| 8 | 2 | 3761.7 | 1.311 | 3108.1 | 1.285 | 2931.6 | 1.300 | 2628.7 | 1.300 |
| 8 | 5 | 3578.2 | 1.660 | 2998.2 | 1.614 | 2812.1 | 1.609 | 2447.6 | 1.523 |
| 32 | 1 | 14637.8 | 1.636 | 12702.5 | 1.644 | 12070.3 | 1.634 | 11036.9 | 1.647 |
| 32 | 2 | 10627.3 | 1.818 | 9198.3 | 1.818 | 8431.6 | 1.725 | 8000.0 | 1.773 |
| 32 | 5 | 8205.7 | 2.598 | 7117.6 | 2.476 | 6825.2 | 2.497 | 6293.2 | 2.437 |
| 128 | 1 | 33800.5 | 2.755 | 30824.5 | 2.816 | 27685.2 | 2.661 | 26580.9 | 2.694 |
| 128 | 2 | 20829.4 | 2.795 | 18665.2 | 2.778 | 17372.1 | 2.639 | 16820.5 | 2.821 |
| 128 | 5 | 11753.9 | 3.309 | 10658.1 | 3.273 | 10308.7 | 3.205 | 9630.7 | 3.328 |
| 512 | 1 | 44474.6 | 3.327 | 40108.1 | 3.394 | 39816.6 | 3.378 | 39708.0 | 3.381 |
| 512 | 2 | 26057.9 | 3.295 | 23197.3 | 3.294 | 23019.8 | 3.284 | 22951.4 | 3.284 |
| 512 | 5 | 12161.5 | 3.428 | 10777.5 | 3.418 | 10733.1 | 3.414 | 10710.5 | 3.420 |
To achieve these same results, follow the Quick Start Guide outlined above.
Inference latency results
Tables presented in this section show the average inference latency (columns Avg
(ms)) and inference latency for various confidence intervals (columns N%
(ms), where N denotes the confidence interval). Inference latency is
measured in milliseconds. Speedups reported in FP16 subsections are relative to
FP32 (for NVIDIA Volta and NVIDIA Turing) and relative to TF32 (for NVIDIA
Ampere) numbers for corresponding configuration.
Inference latency: NVIDIA A100 40GB
Our results were obtained by running the translate.py script in the
pytorch-20.06-py3 NGC Docker container with NVIDIA A100 40GB.
Full command to launch the inference latency benchmark was provided in the
Inference performance benchmark section.
FP16
| Batch Size | Beam Size | Avg (ms) | Speedup | 90% (ms) | Speedup | 95% (ms) | Speedup | 99% (ms) | Speedup |
|---|---|---|---|---|---|---|---|---|---|
| 1 | 1 | 44.69 | 1.032 | 74.04 | 1.035 | 84.61 | 1.034 | 99.14 | 1.042 |
| 1 | 2 | 64.76 | 1.020 | 105.18 | 1.018 | 118.92 | 1.019 | 139.42 | 1.023 |
| 1 | 5 | 67.06 | 1.043 | 107.56 | 1.049 | 121.82 | 1.054 | 143.85 | 1.054 |
| 2 | 1 | 56.57 | 1.034 | 85.59 | 1.037 | 92.55 | 1.038 | 107.59 | 1.046 |
| 2 | 2 | 80.22 | 1.027 | 119.22 | 1.027 | 128.43 | 1.030 | 150.06 | 1.028 |
| 2 | 5 | 82.54 | 1.063 | 121.37 | 1.067 | 132.35 | 1.069 | 156.34 | 1.059 |
| 4 | 1 | 67.29 | 1.047 | 92.69 | 1.048 | 100.08 | 1.056 | 112.63 | 1.064 |
| 4 | 2 | 95.86 | 1.041 | 129.83 | 1.040 | 139.48 | 1.044 | 162.34 | 1.045 |
| 4 | 5 | 98.34 | 1.075 | 133.83 | 1.076 | 142.70 | 1.068 | 168.30 | 1.075 |
| 8 | 1 | 75.60 | 1.099 | 97.87 | 1.103 | 104.13 | 1.099 | 117.40 | 1.102 |
| 8 | 2 | 109.38 | 1.074 | 137.71 | 1.079 | 147.69 | 1.069 | 168.79 | 1.065 |
| 8 | 5 | 112.71 | 1.116 | 143.50 | 1.104 | 153.17 | 1.118 | 172.60 | 1.113 |
| 32 | 1 | 98.40 | 1.146 | 117.02 | 1.153 | 123.42 | 1.150 | 129.01 | 1.128 |
| 32 | 2 | 145.87 | 1.133 | 171.71 | 1.159 | 184.01 | 1.127 | 188.64 | 1.141 |
| 32 | 5 | 156.82 | 1.357 | 189.10 | 1.374 | 194.95 | 1.392 | 196.65 | 1.419 |
| 128 | 1 | 137.97 | 1.350 | 150.04 | 1.348 | 151.52 | 1.349 | 154.52 | 1.434 |
| 128 | 2 | 211.58 | 1.484 | 232.96 | 1.490 | 237.46 | 1.505 | 239.86 | 1.567 |
| 128 | 5 | 261.44 | 1.990 | 288.54 | 2.017 | 291.63 | 2.052 | 298.73 | 2.136 |
| 512 | 1 | 245.93 | 1.906 | 262.51 | 1.998 | 264.24 | 1.999 | 265.23 | 2.000 |
| 512 | 2 | 395.61 | 2.129 | 428.54 | 2.219 | 431.58 | 2.224 | 433.86 | 2.227 |
| 512 | 5 | 627.21 | 2.767 | 691.72 | 2.878 | 696.01 | 2.895 | 702.13 | 2.887 |
Inference latency: NVIDIA T4
Our results were obtained by running the translate.py script in the
pytorch-20.06-py3 NGC Docker container with NVIDIA T4.
Full command to launch the inference latency benchmark was provided in the
Inference performance benchmark section.
FP16
| Batch Size | Beam Size | Avg (ms) | Speedup | 90% (ms) | Speedup | 95% (ms) | Speedup | 99% (ms) | Speedup |
|---|---|---|---|---|---|---|---|---|---|
| 1 | 1 | 51.08 | 1.261 | 84.82 | 1.254 | 97.45 | 1.251 | 114.6 | 1.257 |
| 1 | 2 | 72.05 | 1.168 | 117.41 | 1.165 | 132.33 | 1.170 | 155.8 | 1.174 |
| 1 | 5 | 74.20 | 1.345 | 119.45 | 1.352 | 135.07 | 1.354 | 160.3 | 1.354 |
| 2 | 1 | 66.31 | 1.232 | 100.90 | 1.232 | 108.52 | 1.235 | 126.9 | 1.238 |
| 2 | 2 | 88.35 | 1.185 | 131.47 | 1.188 | 141.46 | 1.185 | 164.7 | 1.191 |
| 2 | 5 | 92.12 | 1.305 | 136.30 | 1.310 | 148.66 | 1.309 | 174.8 | 1.320 |
| 4 | 1 | 78.54 | 1.260 | 108.53 | 1.256 | 117.19 | 1.259 | 133.7 | 1.259 |
| 4 | 2 | 105.54 | 1.315 | 142.74 | 1.317 | 154.36 | 1.307 | 178.7 | 1.303 |
| 4 | 5 | 110.43 | 1.351 | 150.62 | 1.388 | 161.61 | 1.397 | 191.2 | 1.427 |
| 8 | 1 | 91.65 | 1.418 | 117.92 | 1.421 | 126.60 | 1.405 | 144.0 | 1.411 |
| 8 | 2 | 123.39 | 1.315 | 156.00 | 1.337 | 167.34 | 1.347 | 193.4 | 1.340 |
| 8 | 5 | 129.69 | 1.666 | 165.01 | 1.705 | 178.18 | 1.723 | 200.3 | 1.765 |
| 32 | 1 | 126.53 | 1.641 | 153.23 | 1.689 | 159.58 | 1.692 | 167.0 | 1.700 |
| 32 | 2 | 174.37 | 1.822 | 209.04 | 1.899 | 219.59 | 1.877 | 228.6 | 1.878 |
| 32 | 5 | 226.15 | 2.598 | 277.38 | 2.636 | 290.27 | 2.648 | 299.4 | 2.664 |
| 128 | 1 | 218.29 | 2.755 | 238.94 | 2.826 | 243.18 | 2.843 | 267.1 | 2.828 |
| 128 | 2 | 354.83 | 2.796 | 396.63 | 2.832 | 410.53 | 2.803 | 433.2 | 2.866 |
| 128 | 5 | 628.32 | 3.311 | 699.57 | 3.353 | 723.98 | 3.323 | 771.0 | 3.337 |
| 512 | 1 | 663.07 | 3.330 | 748.62 | 3.388 | 753.20 | 3.388 | 758.0 | 3.378 |
| 512 | 2 | 1134.04 | 3.295 | 1297.85 | 3.283 | 1302.25 | 3.304 | 1306.9 | 3.308 |
| 512 | 5 | 2428.82 | 3.428 | 2771.72 | 3.415 | 2801.32 | 3.427 | 2817.6 | 3.422 |
To achieve these same results, follow the Quick Start Guide outlined above.